Statistics from the Office of the Information Commissioner of Canada Appearance before ETHI (February 9, 2026)
In the last five years, access to information complaints have ranged between 1.5% and 3% of all access requests.
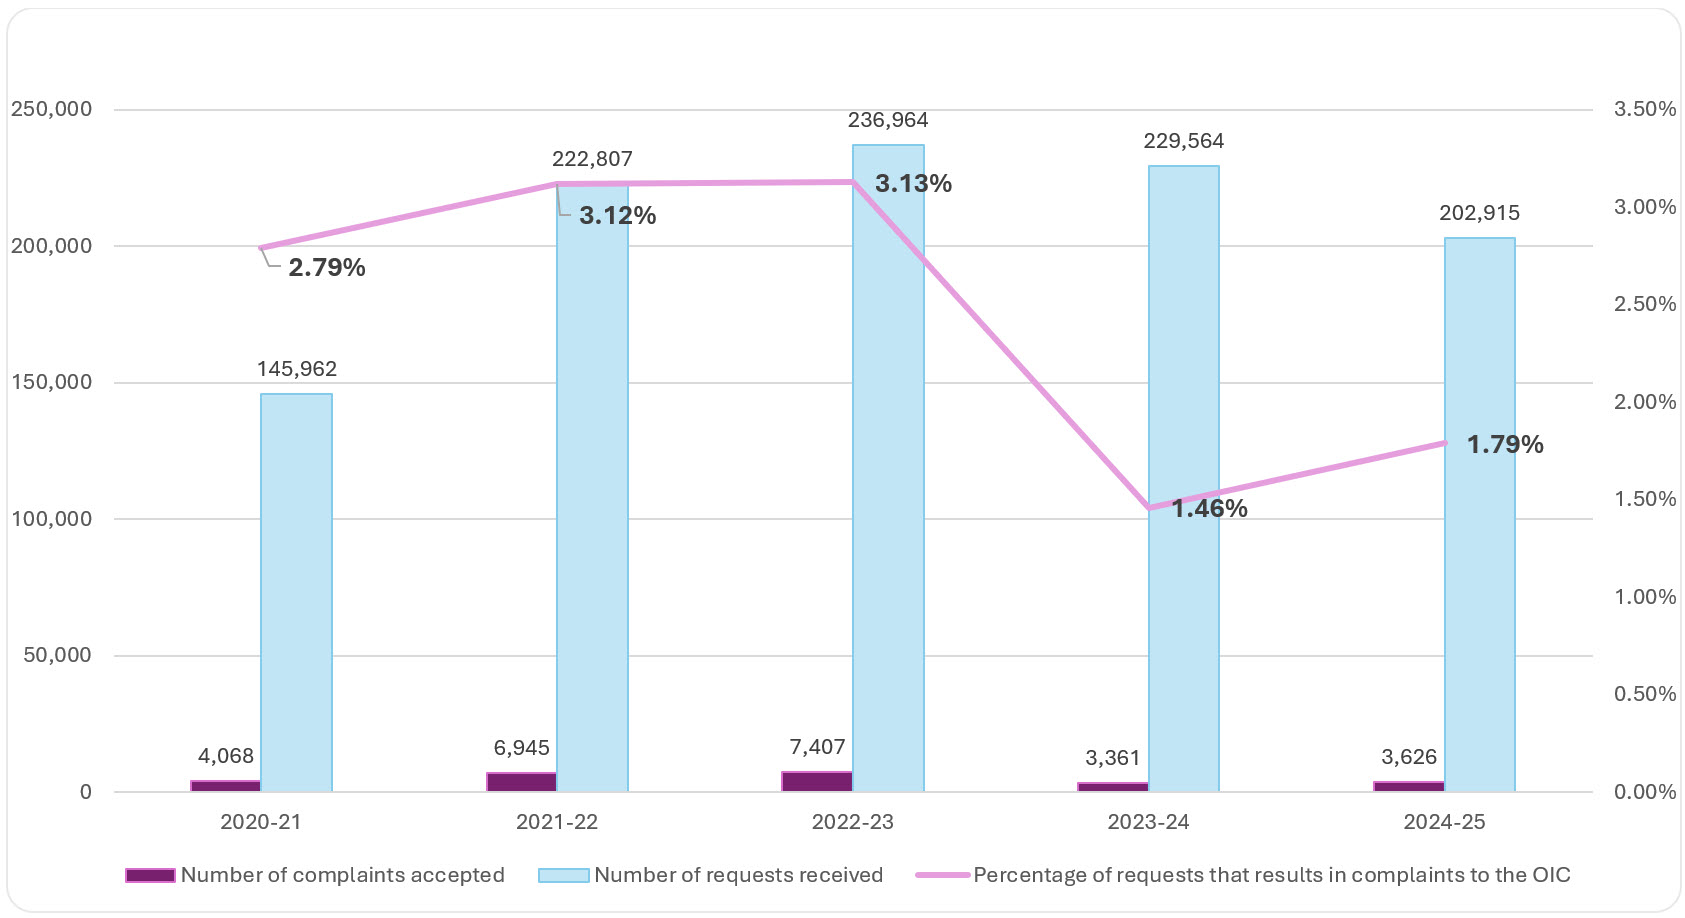
Text version
| Year | Number of complaints accepted | Number of requests received | Percentage of requests that result in complaints to the OIC |
|---|---|---|---|
| 2020-21 | 4,068 | 145,962 | 2.79% |
| 2021-22 | 6,945 | 222,807 | 3.12% |
| 2022-23 | 7,407 | 236,964 | 3.13% |
| 2023-24 | 3,361 | 229,764 | 1.46% |
| 2024-25 | 3,626 | 202,915 | 1.79% |
Inventory
There are currently 2,123 complaints in the OIC inventory; 10% are more than two years old. The goal is to stay under 15%.
Top 5 institutions in inventory, as of February 2, 2026
| Institution | Number (Percentage of complaints in inventory) |
|---|---|
| Privy Council Office | 244 (12%) |
| Immigration, Refugees and Citizenship Canada | 237 (11%) |
| Transport Canada | 216 (10%) |
| Library and Archives Canada | 114 (5%) |
| Global Affairs Canada | 114 (5%) |
Complaints and orders
| Chart showing complaints concluded and orders issued by the OIC across government, 2019-2020 to 2024–2025 | 2019–20 | 2020–21 | 2021–22 | 2022–23 | 2023–24 | 2024–25 | 2025-26 (as of Feb. 2, 2026) |
|---|---|---|---|---|---|---|---|
| Complaints concluded through investigations | 5,528 | 4,060 | 6,787 | 8,089 | 4,183 | 4,108 | 3,233 |
| Complaints concluded through investigations – Cease to investigate | 4,057 | 2,867 | 4,854 | 4,854 | 2,527 | 2,123 | 1,556 |
| Complaints concluded by Registry | n/a | n/a | n/a | n/a | 1,497 | 1,298 | 1,519 |
| Total complaints concluded | 5,528 | 4,060 | 6,787 | 8,089 | 5,680 | 5,406 | 4,752 |
| Orders – delay and extension of time complaints | 0 | 2 | 25 | 135 | 275 | 329 | 238 |
| Orders – refusal complaints | 0 | 0 | 2 | 22 | 35 | 46 | 34 |
| Total orders issued | 0 | 2 | 27 | 157 | 310 | 375 | 272 |
| % of orders issued – complaints concluded through investigations | 0% | 0.49% | 0.40% | 1.94% | 7.41% | 9.13% | 8.41% |
| % of orders issued – all complaints concluded | 0% | 0.49% | 0.40% | 1.94% | 5.45% | 6.93% | 5.72% |
Evolution over 5 years: Top 3 institutions for which orders were issued, April 1, 2021, to February 2, 2026
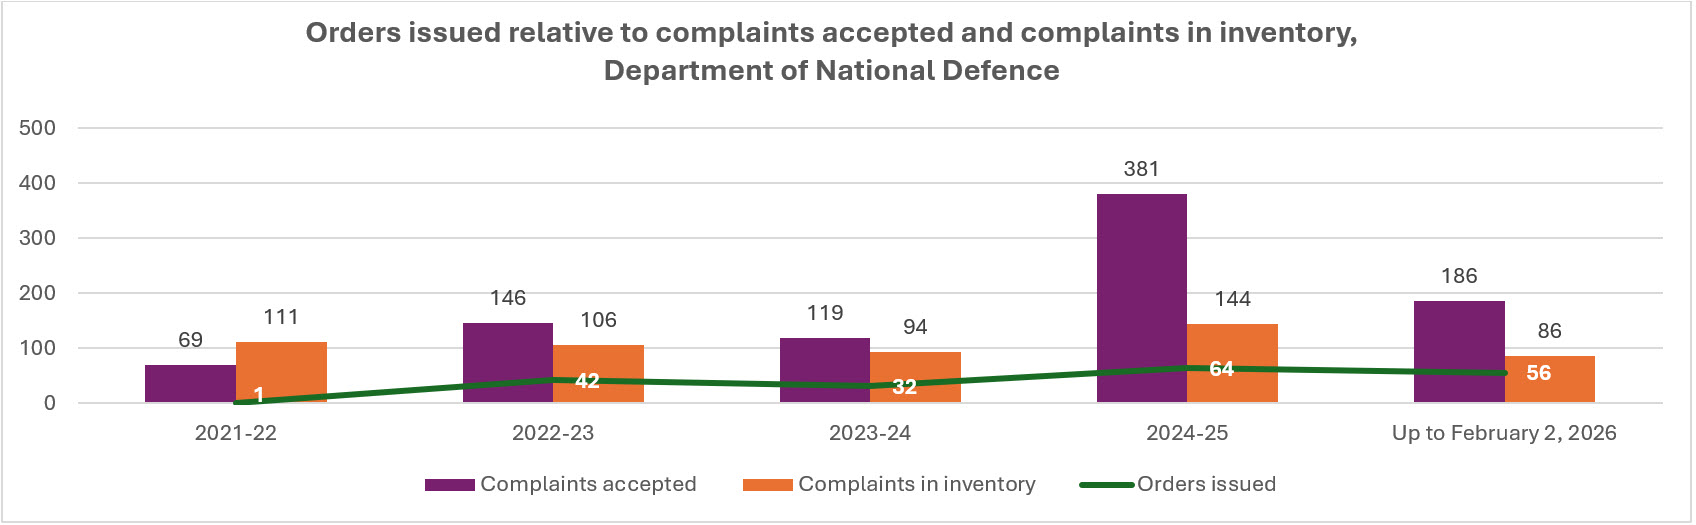
Text version
Year | Complaints accepted | Complaints in inventory | Orders issued |
|---|---|---|---|
| 2021-22 | 69 | 111 | 1 |
| 2022-23 | 146 | 106 | 42 |
| 2023-24 | 119 | 94 | 32 |
| 2024-25 | 381 | 144 | 64 |
| Up to February 2, 2026 | 186 | 86 | 56 |
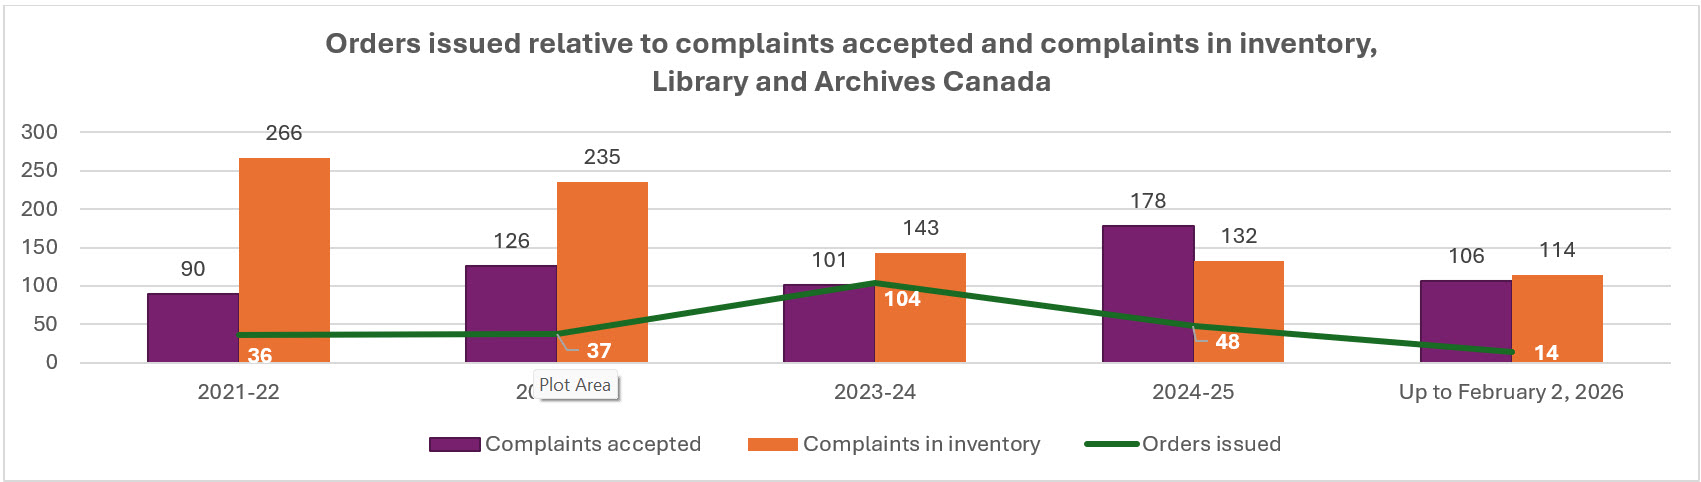
Text version
Year | Complaints accepted | Complaints in inventory | Orders issued |
|---|---|---|---|
| 2021-22 | 90 | 266 | 36 |
| 2022-23 | 126 | 235 | 37 |
| 2023-24 | 101 | 143 | 104 |
| 2024-25 | 178 | 132 | 48 |
| Up to February 2, 2026 | 106 | 114 | 14 |
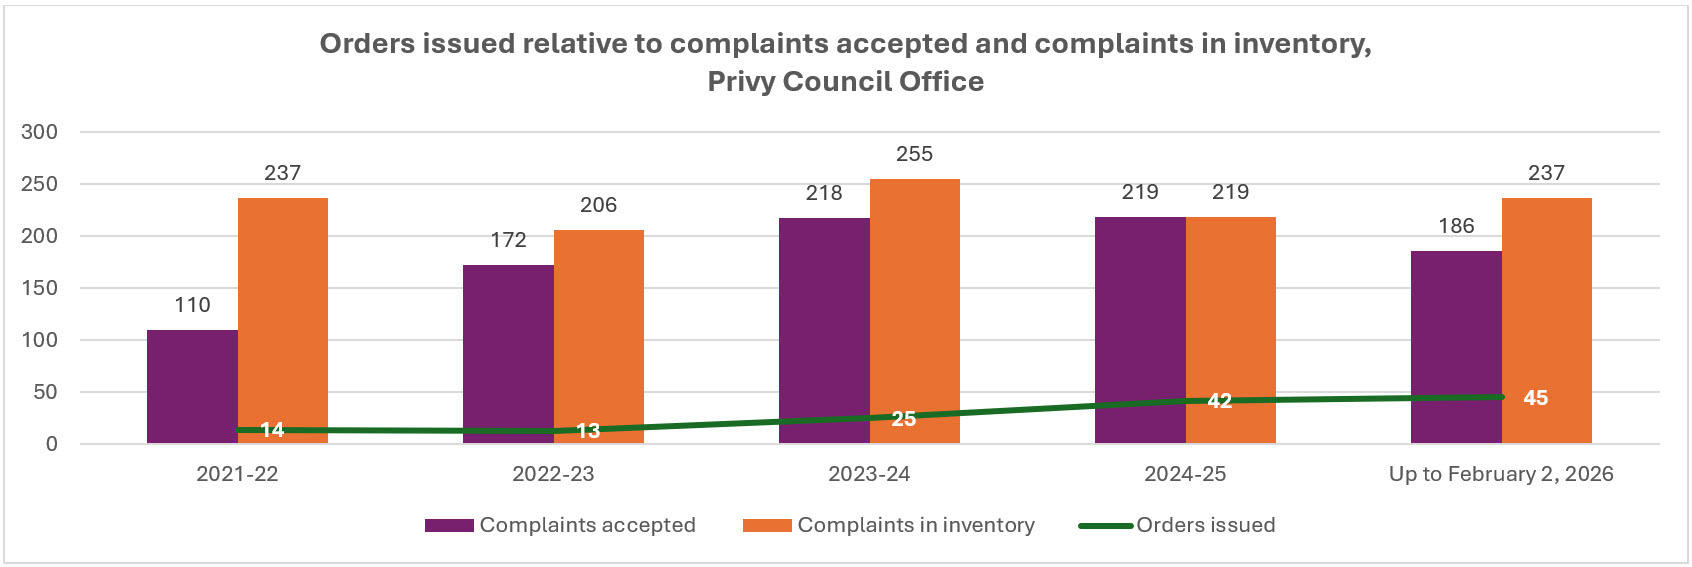
Text version
Year | Complaints accepted | Complaints in inventory | Orders issued |
|---|---|---|---|
| 2021-22 | 110 | 237 | 14 |
| 2022-23 | 172 | 206 | 13 |
| 2023-24 | 218 | 255 | 25 |
| 2024-25 | 219 | 219 | 42 |
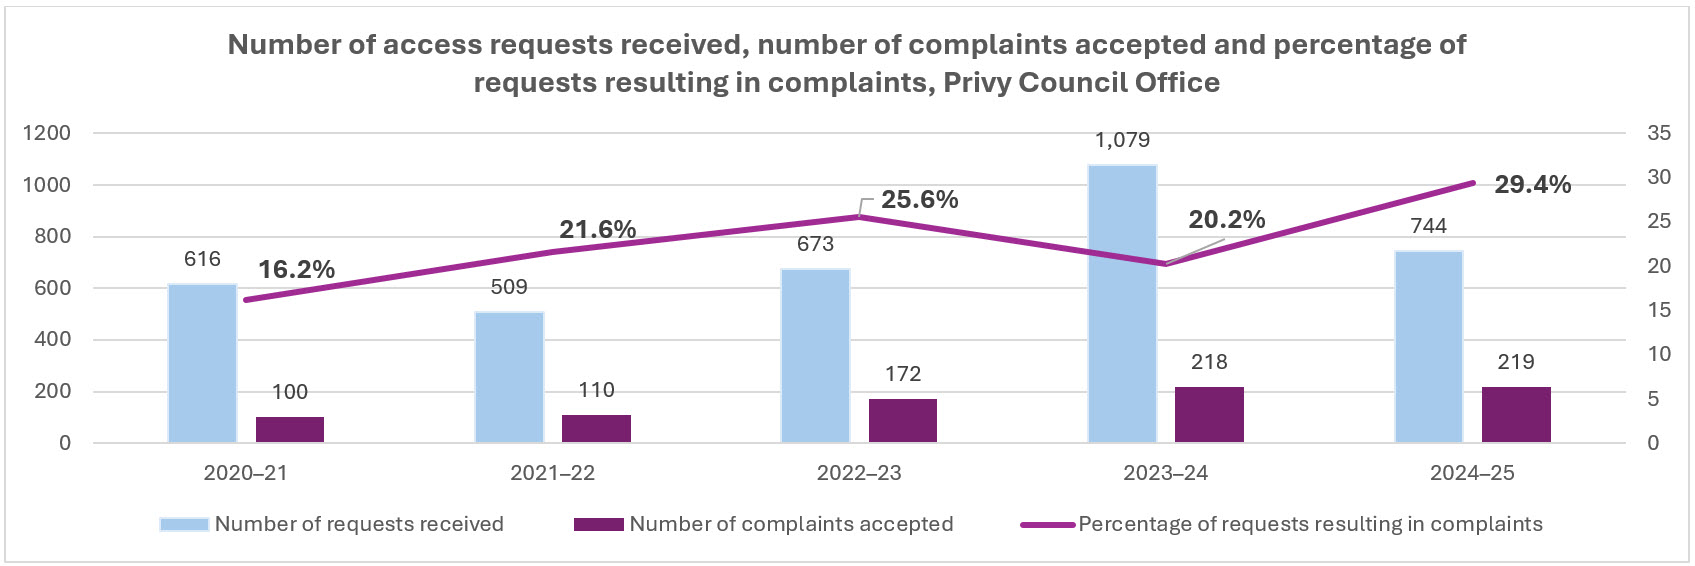
Text version
Year | Number of requests received | Number of complaints accepted | Percentage of requests that result in complaints to the OIC |
|---|---|---|---|
| 2020-21 | 616 | 100 | 16.2% |
| 2021-22 | 509 | 110 | 21.6% |
| 2022-23 | 673 | 172 | 25.6% |
| 2023-24 | 1,079 | 218 | 20.2% |
| 2024-25 | 744 | 219 | 29.4% |