Observations on the state of the access to information system (2024-2025)
Executive summary
This report analyzes statistical information related to the administration of the Access to Information Act (the Act) submitted by 198 federal institutions to the Treasury Board of Canada Secretariat (TBS) for the fiscal year 2024-25. It is based on the Access to Information and Privacy Statistical Report for 2024-25 published on December 16, 2025, on the TBS website.
Key observations
Ongoing challenges in timely request completion
- More than 20% of requests were not closed within legislated timelines in 2024-25.
- When excluding Immigration, Refugees and Citizenship Canada (which received more than 80% of all requests), 35% of requests were not responded to within legislated timelines.
Fewer formal requests, but higher costs and more informal requests and pages processed
- Although the number of requests decreased in 2024-25, both the number of pages processed and the average cost per access request increased.
- Excluding IRCC, there was a 33% increase in pages processed compared with 2023-24.
- There was a significant rise in informal requests.
- For the second consecutive year, more requests were closed than received.
Media engagement rebounds
- When excluding IRCC, 16.5% of requests were made by media in 2024-25.
- This is in line with pre-pandemic levels.
Access to information requests received
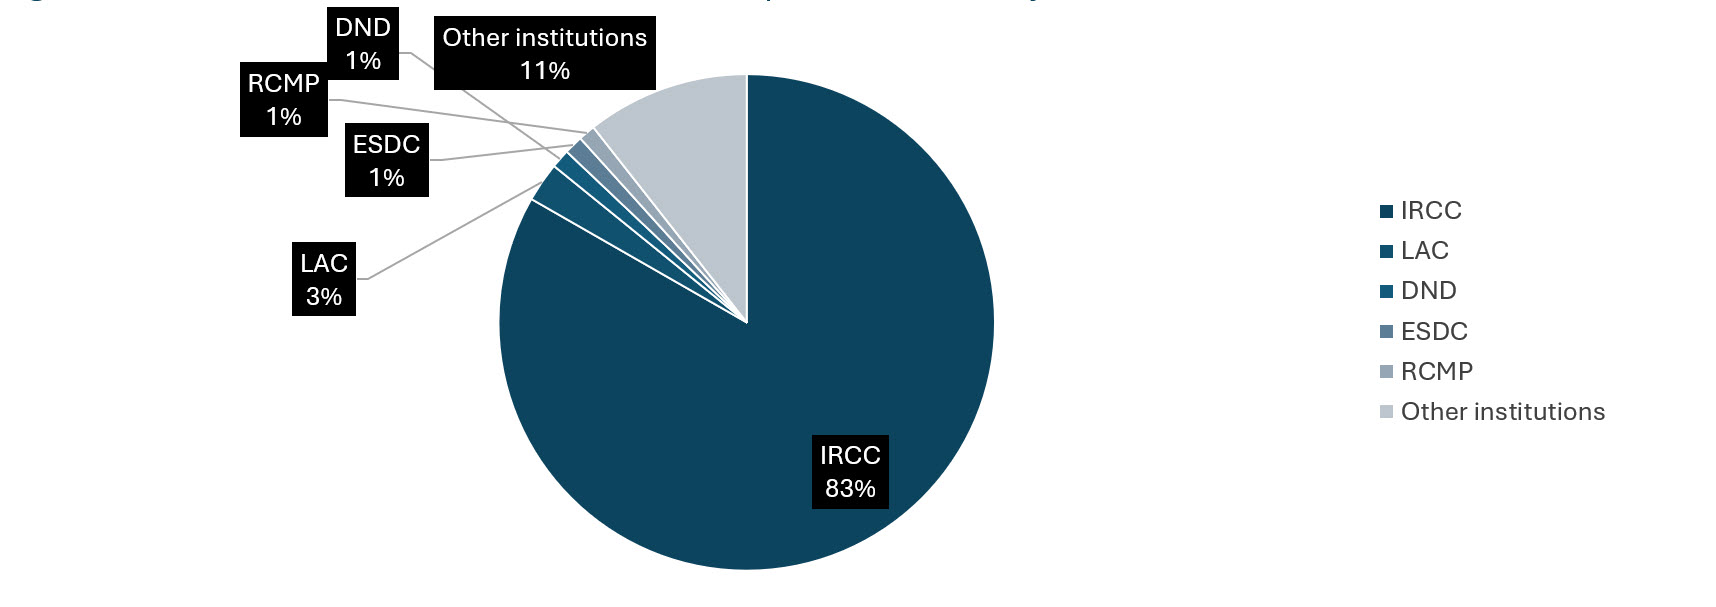
During the 2024-25 reporting period, a total of 202,915 access to information requests were received, representing a 11.6% decrease from the previous year. IRCC continues to receive most requests.
- IRCC accounted for 83.3% of all requests.
- Library and Archives Canada (LAC) received 2.6% of requests.
- The Department of National Defence (DND), Employment and Social Development Canada (ESDC), and the Royal Canadian Mounted Police (RCMP) collectively accounted for 3.5% of requests.
- All remaining institutions received 10.6% of total requests.
Of all institutions, 75.7% receive less than 50 requests, and 56.5% receive fewer than 10 requests.
Figure 1: Distribution of access to information requests received by institution, 2024-25
*Rounded to the nearest whole number.
Text version
| Distribution of access to information requests received by institution, 2024-25 | Percentage of requests received |
|---|---|
IRCC | 83.28% |
LAC | 2.57% |
DND | 1.23% |
ESDC | 1.22% |
RCMP | 1.10% |
Other institutions | 10.60% |
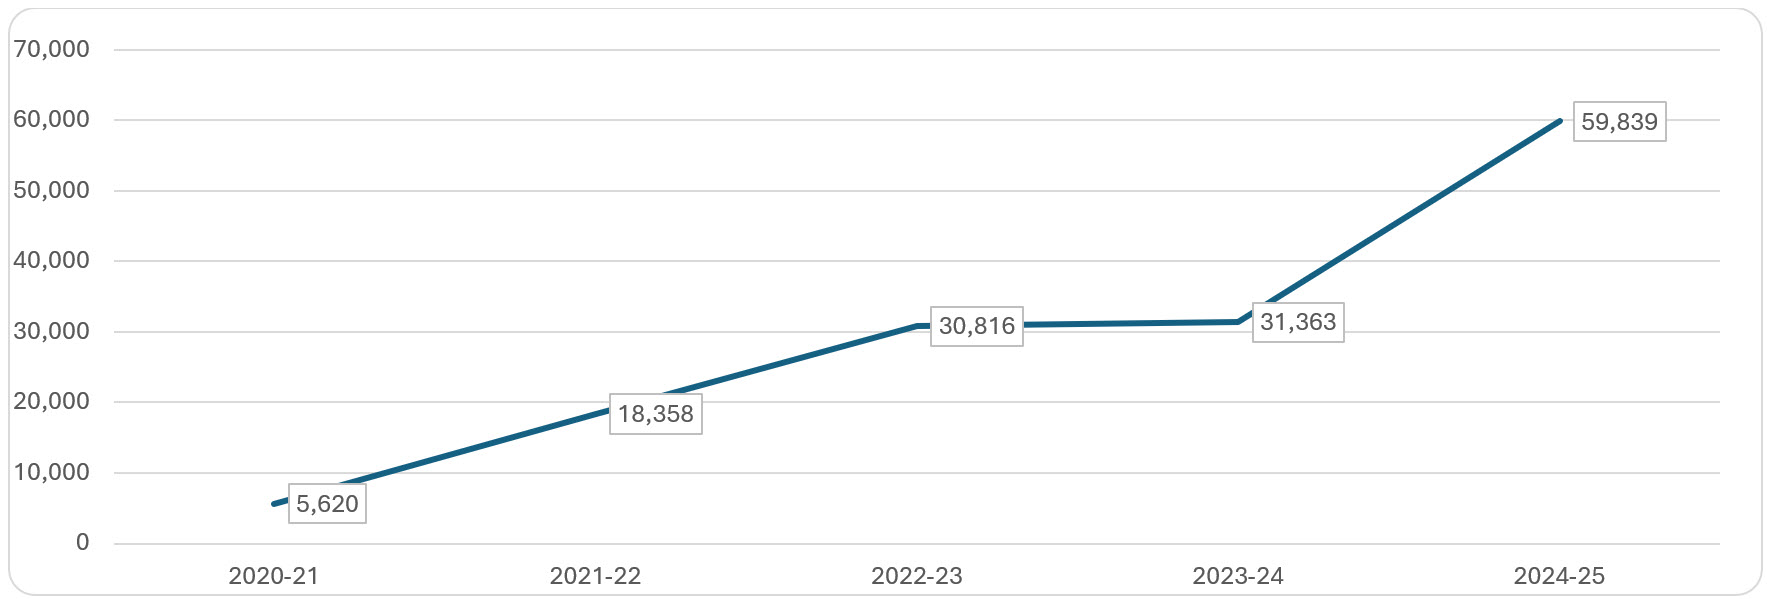
Figure 2: Number of informal access to information requests received by institution (including IRCC), 2020-21 to 2024-25
Text version
| Reporting Year | Number of informal access to information requests received by institution (including IRCC) |
|---|---|
2020-21 | 5,620 |
2021-22 | 18,358 |
2022-23 | 30,816 |
2023-24 | 31,363 |
2024-25 | 59,839 |
In 2024-25, 59,839 informal requests were received across government. This is a 90.8% increase from the previous year, and a 964.8% increase from 2020-21. IRCC accounts for 21% of all informal access requests. DND, LAC, Global Affairs Canada (GAC), RCMP, Canada Revenue Agency (CRA), Innovation, Science and Economic Development Canada (ISED), Natural Resources Canada (NRCAN), and Health Canada collectively account for 36% of informal requests.
An informal access to information request is a request for information made to the Access to Information and Privacy (ATIP) office of a government institution that is not made or processed under the Act. They may include:
- Formal requests that were discontinued in favour of providing information informally, in consultation with the requester as part of the Duty to Assist;
- Advising requesters when information is already publicly available online; and
- The re-release of information made available through previously closed formal requests.
Source of access to information requests
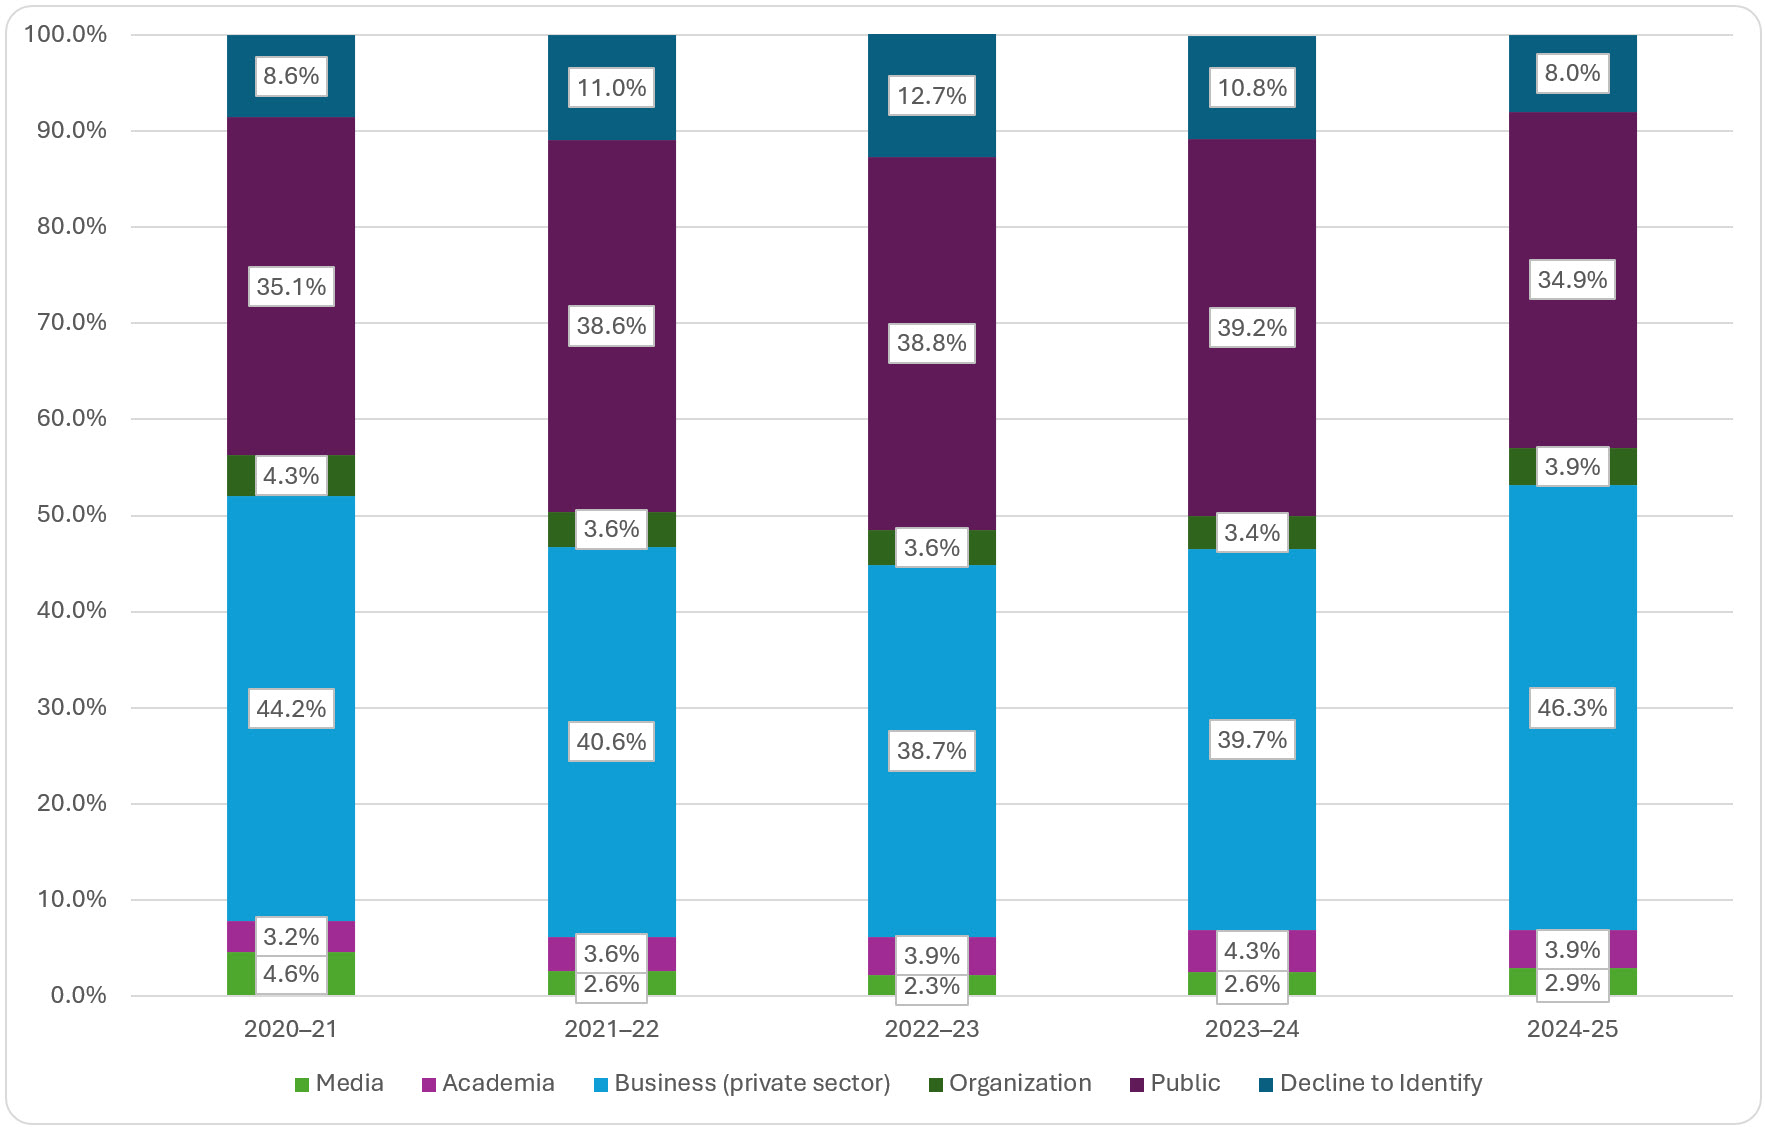
During the 2024-25 reporting period, 81.2% of all access to information requests were received from businesses and the public. A further 8% of requesters declined to identify themselves. Academia, organizations and the media made up the remainder of requesters.
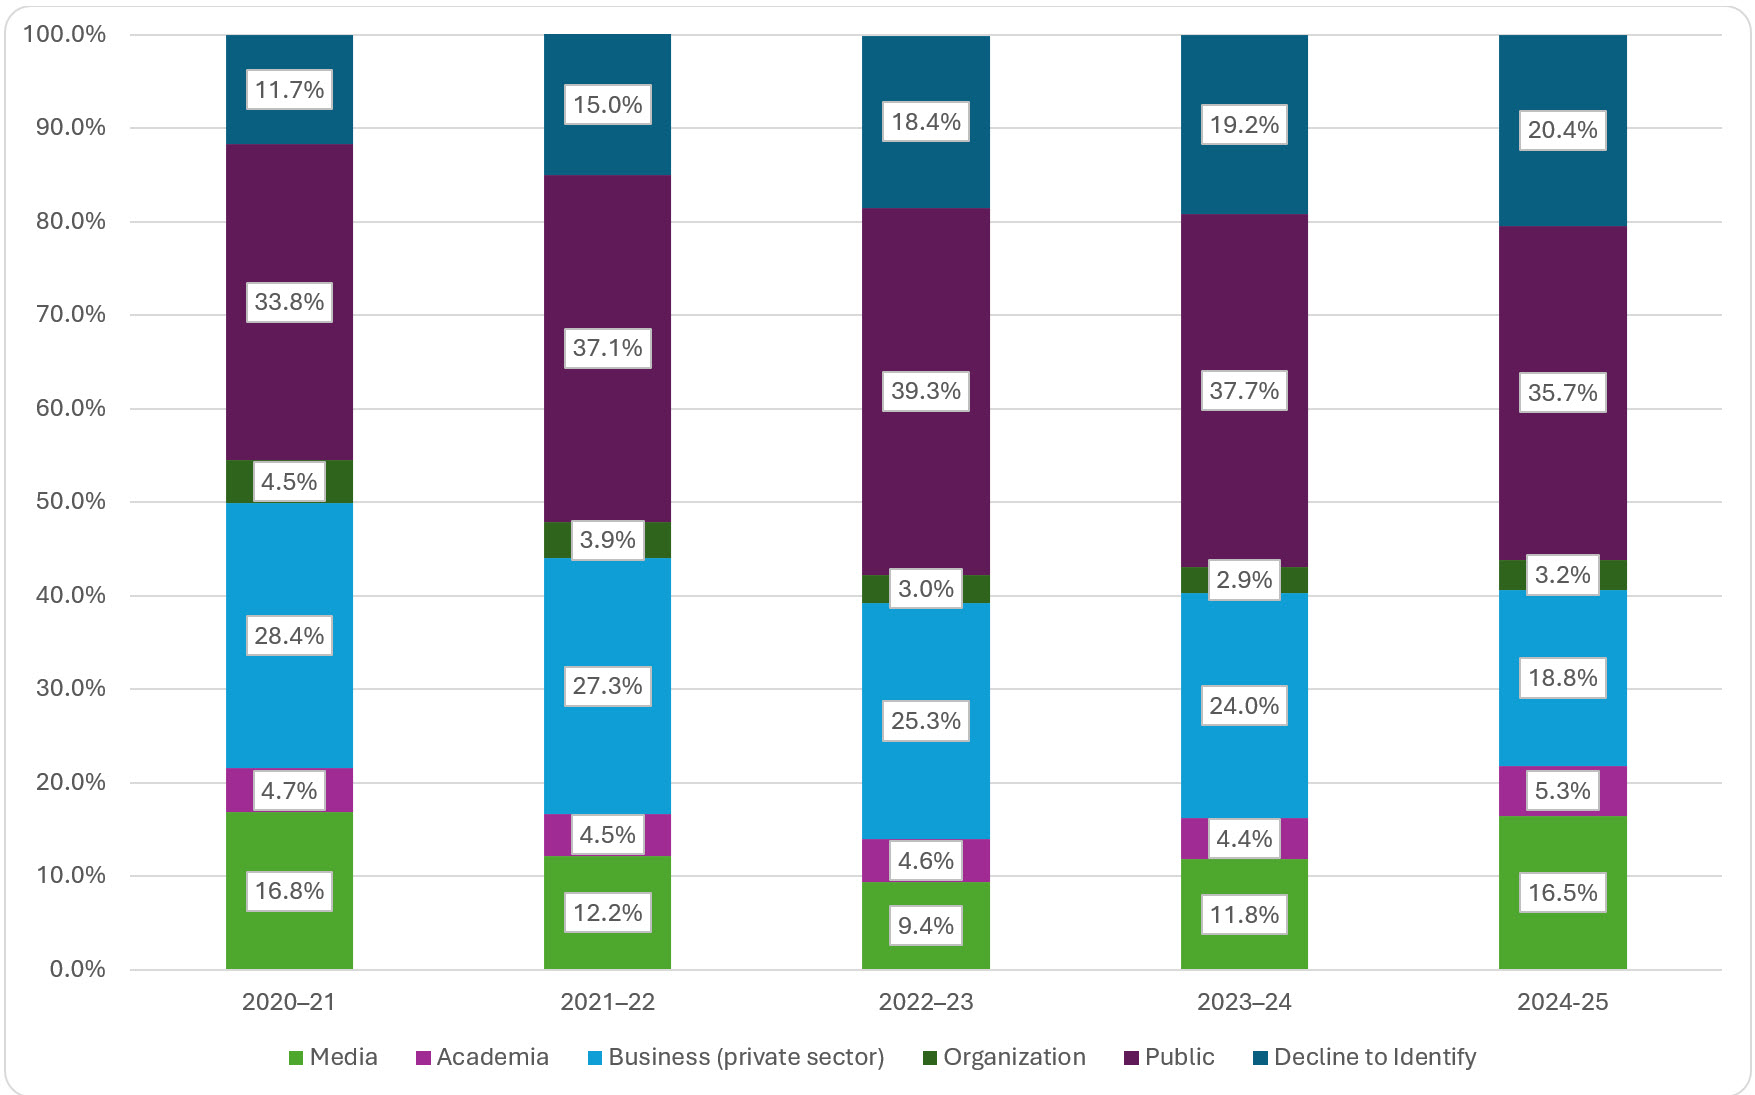
Across all institutions, business-sector requests accounted for 46.3% requests. When IRCC is excluded, this figure drops to 18.8%.
While the media accounts for only 2.9% of requests government-wide, that share jumps to 16.5% when IRCC is removed from the data. This represents a nearly 5% increase in media interest compared to 2023-24, returning to levels seen in 2020-21.
Figure 3: Source of access requests (including IRCC), 2020-21 to 2024-25
Text version
| Source of access requests (all institutions including IRCC), 2020-21 to 2024-25 | 2020-21 | 2021-22 | 2022-23 | 2023-24 | 2024-25 |
|---|---|---|---|---|---|
Media | 4.6% | 2.6% | 2.3% | 2.6% | 2.9% |
Academia | 3.2% | 3.6% | 3.9% | 4.3% | 3.9% |
Business (private sector) | 44.2% | 40.6% | 38.7% | 39.7% | 46.3% |
Organization | 4.3% | 3.6% | 3.6% | 3.4% | 3.9% |
Public | 35.1% | 38.6% | 38.8% | 39.2% | 34.9% |
Decline to Identify | 8.6% | 11.0% | 12.7% | 10.8% | 8.0% |
Figure 4: Source of access requests (excluding IRCC), 2020-21 to 2024-25
Text version
| Source of access requests (excluding IRCC), 2020-21 to 2024-25 | 2020-21 | 2021-22 | 2022-23 | 2023-24 | 2024-25 |
|---|---|---|---|---|---|
Media | 16.8% | 12.2% | 9.4% | 11.8% | 16.5% |
Academia | 4.7% | 4.5% | 4.6% | 4.4% | 5.3% |
Business (private sector) | 28.4% | 27.3% | 25.3% | 24.0% | 18.8% |
Organization | 4.5% | 3.9% | 3.0% | 2.9% | 3.2% |
Public | 33.8% | 37.1% | 39.3% | 37.7% | 35.7% |
Decline to Identify | 11.7% | 15.0% | 18.4% | 19.2% | 20.4% |
Requests closed
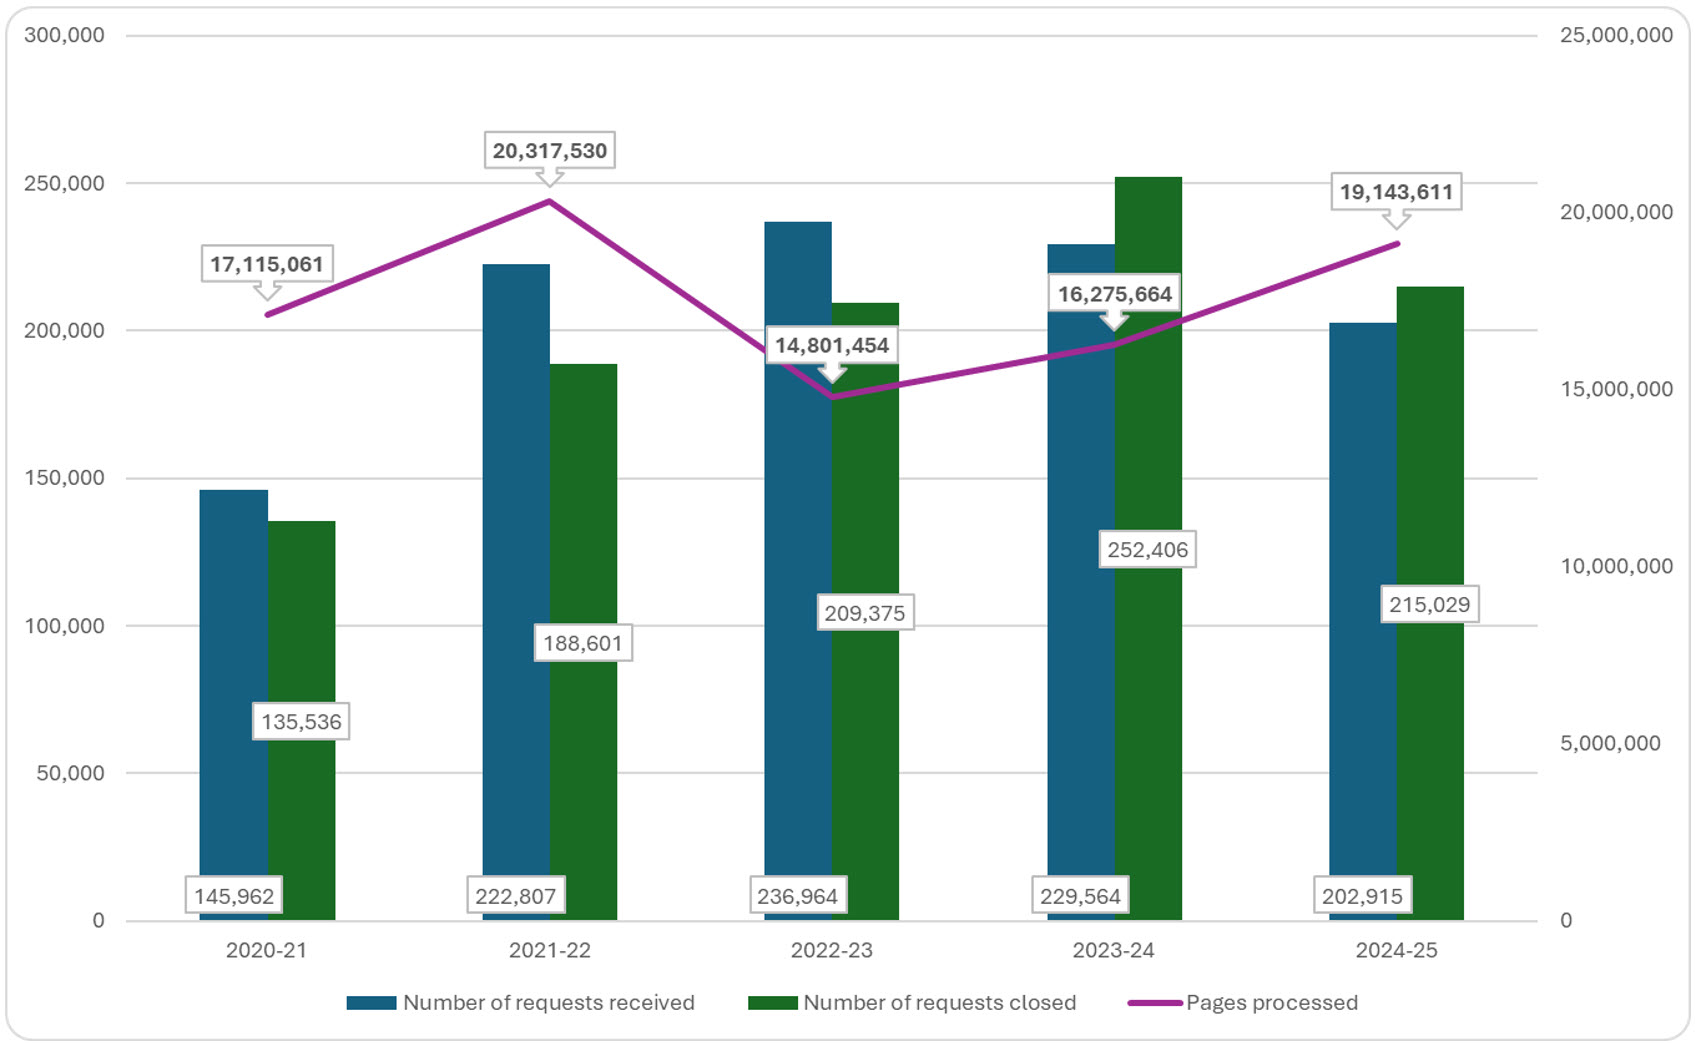
In 2024-25, more requests were closed than received. This is the second consecutive reporting period where more requests were closed than received.
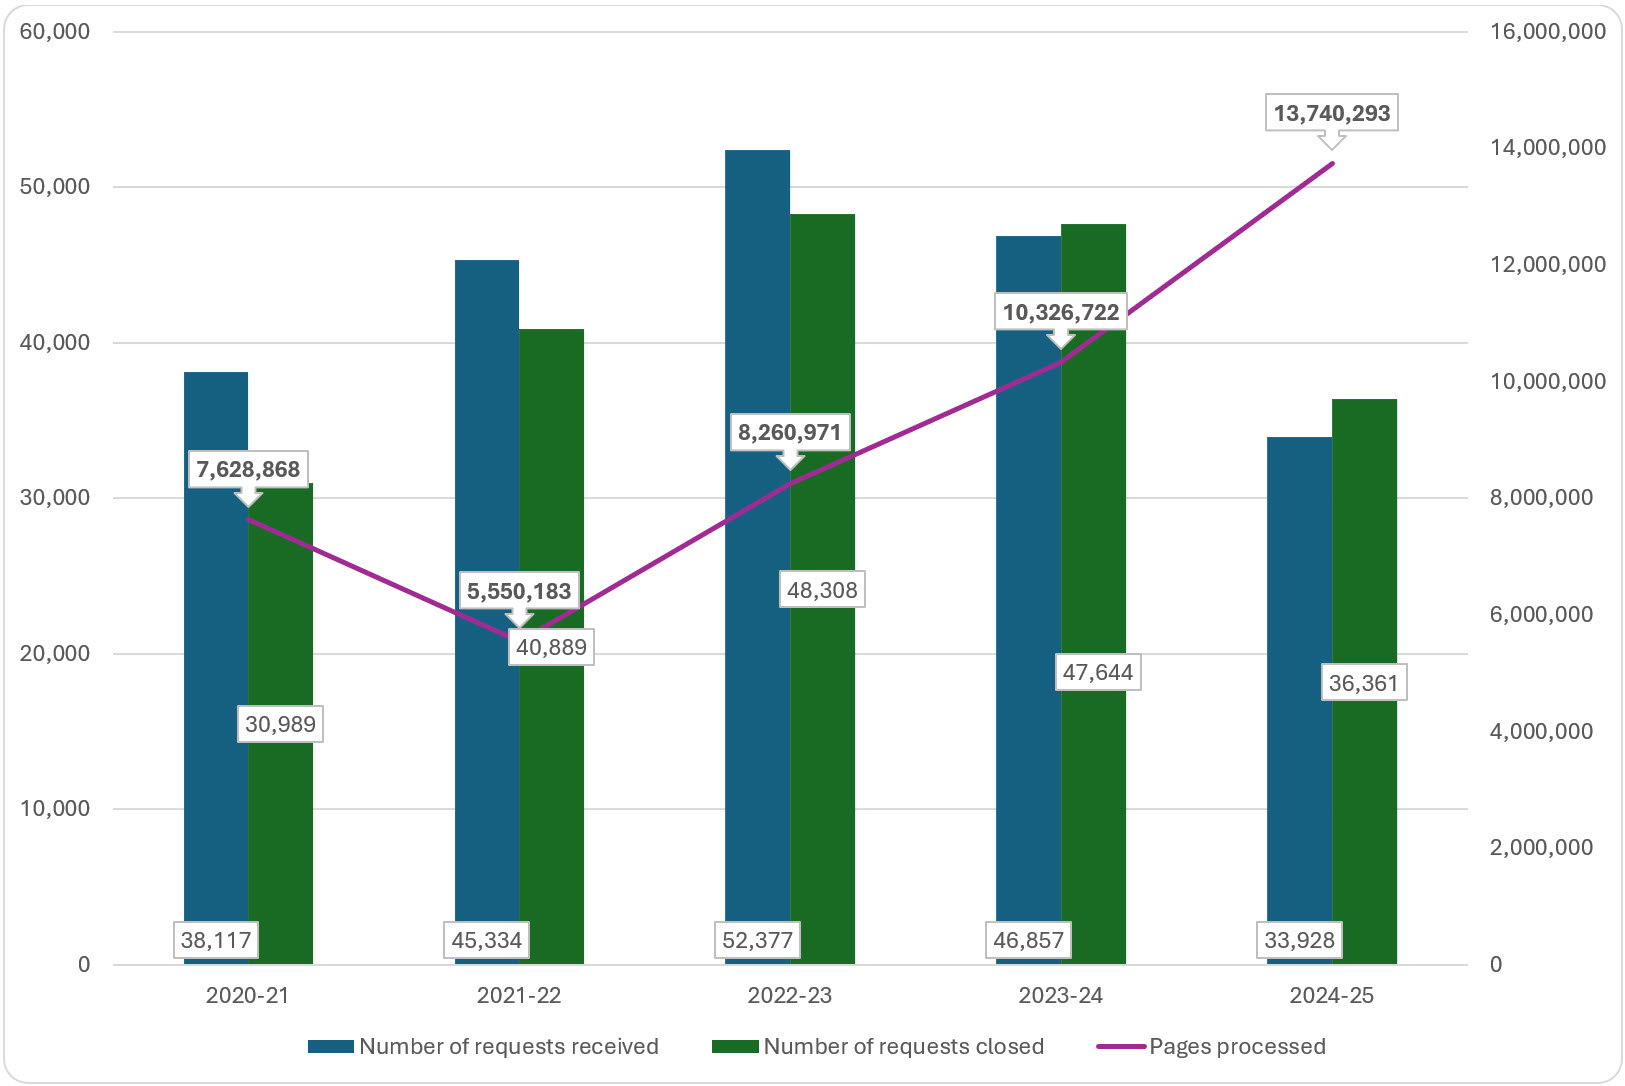
Including IRCC, 6% more requests were closed than received by institutions. When IRCC is excluded, 7.2% more requests were closed than received.
While fewer requests were received overall, there has been a steady increase in the number of pages processed over the last four reporting years. This growing number of pages may be attributed to requests for databases, Excel spreadsheets, and Teams messages, which are often spread across hundreds of pages. Excluding IRCC, there was a 33% increase in pages processed compared with from 2023-24.
Figure 5: Access to information requests trend (including IRCC), 2020-21 to 2024-25
Text version
| Access to information requests trend (including IRCC), 2020-21 to 2024-25 | Number of requests received | Number of requests closed | Pages processed |
|---|---|---|---|
2020-21 | 145,962 | 135,536 | 17,115,061 |
2021-22 | 222,807 | 188,601 | 20,317,530 |
2022-23 | 236,964 | 209,375 | 14,801,454 |
2023-24 | 229,564 | 252,406 | 16,275,664 |
2024-25 | 202,915 | 215,029 | 19,143,611 |
Figure 6: Access to information requests trend (excluding IRCC), 2020-21 to 2024-25
Text version
| Access to information requests trend (excluding IRCC), 2020-21 to 2024-25 | Number of requests received | Number of requests closed | Pages processed |
|---|---|---|---|
2020-21 | 38,117 | 30,989 | 7,628,868 |
2021-22 | 45,334 | 40,889 | 5,550,183 |
2022-23 | 52,377 | 48,308 | 8,260,971 |
2023-24 | 46,857 | 47,644 | 10,326,722 |
2024-25 | 33,928 | 36,361 | 13,740,293 |
Privacy requests received
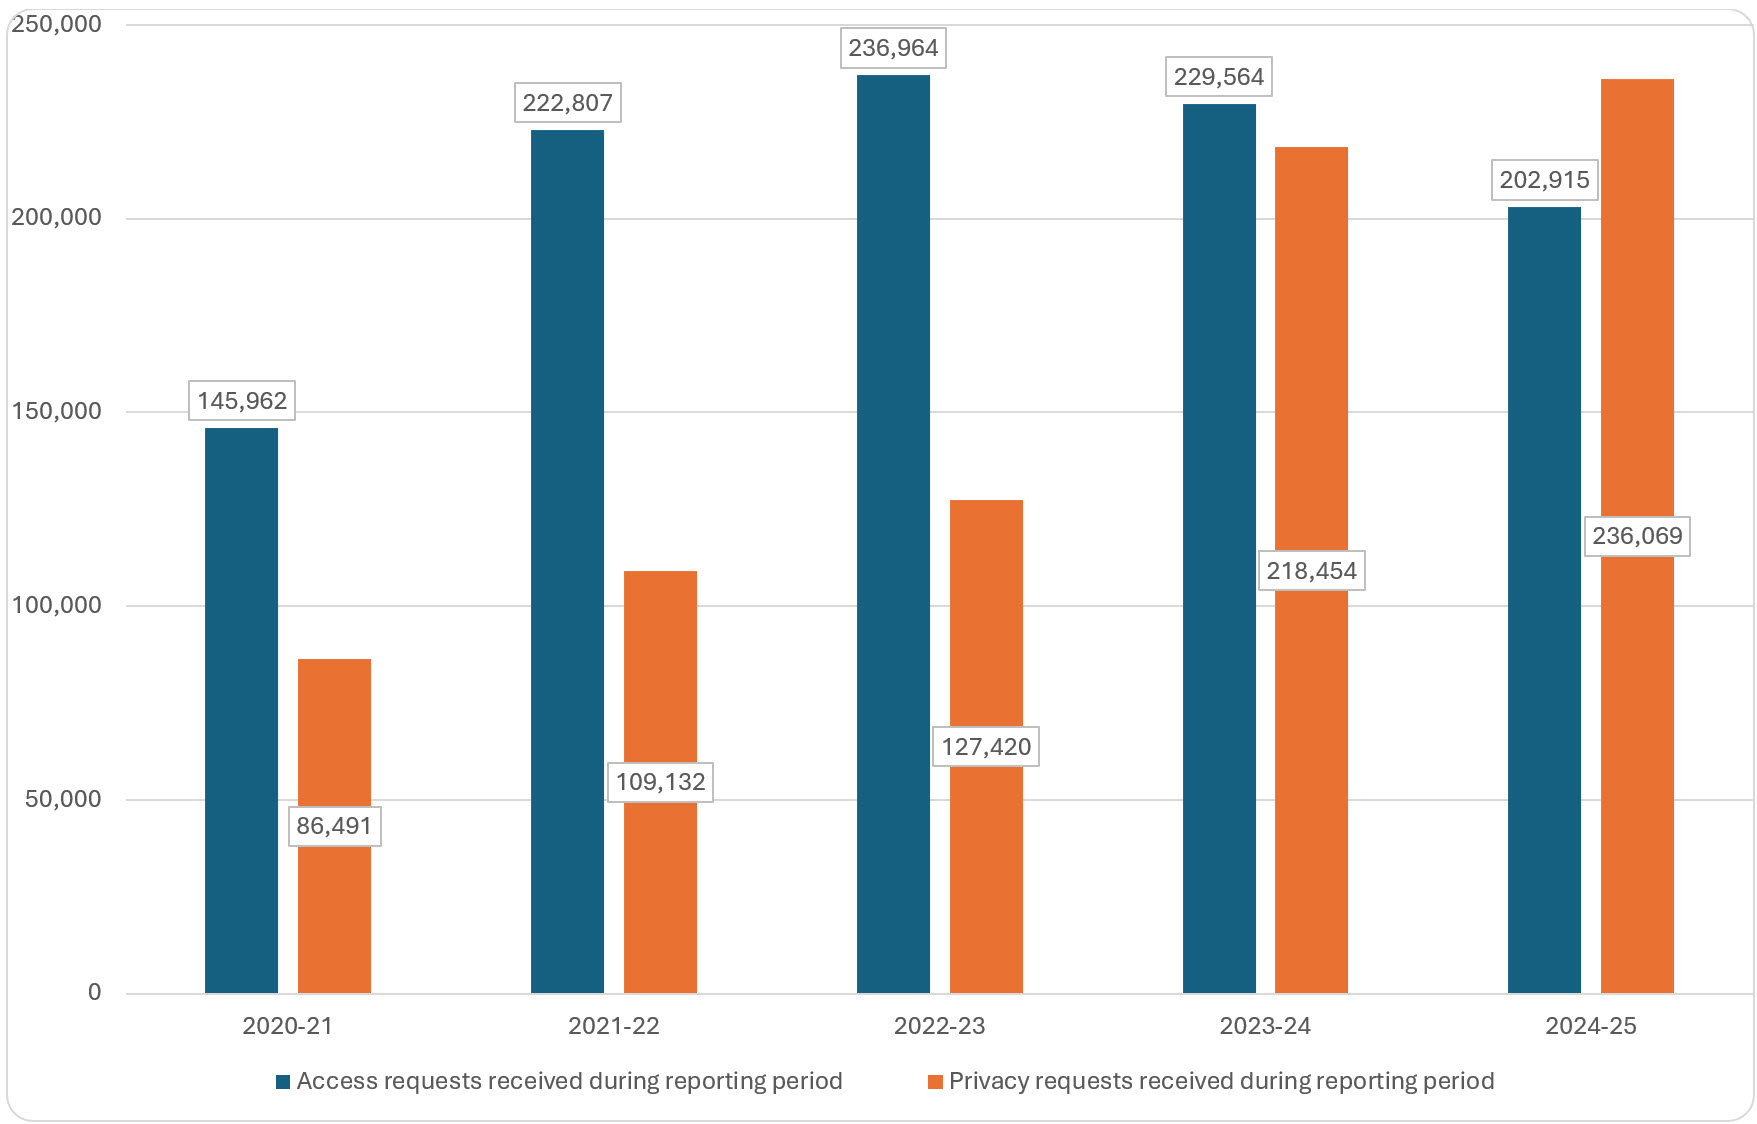
Privacy requests continue to rise in 2024-25, with an 8% increase from 2023-24. CBSA experienced an increase of 47.3% from the previous year, while IRCC saw a 45.6% increase for the same period.
In fact, IRCC accounted for 83.3% of all access to information requests and 43% of all personal information requests received in 2024-25 (including 77.4% of all requests for personal information by foreign nationals outside Canada).
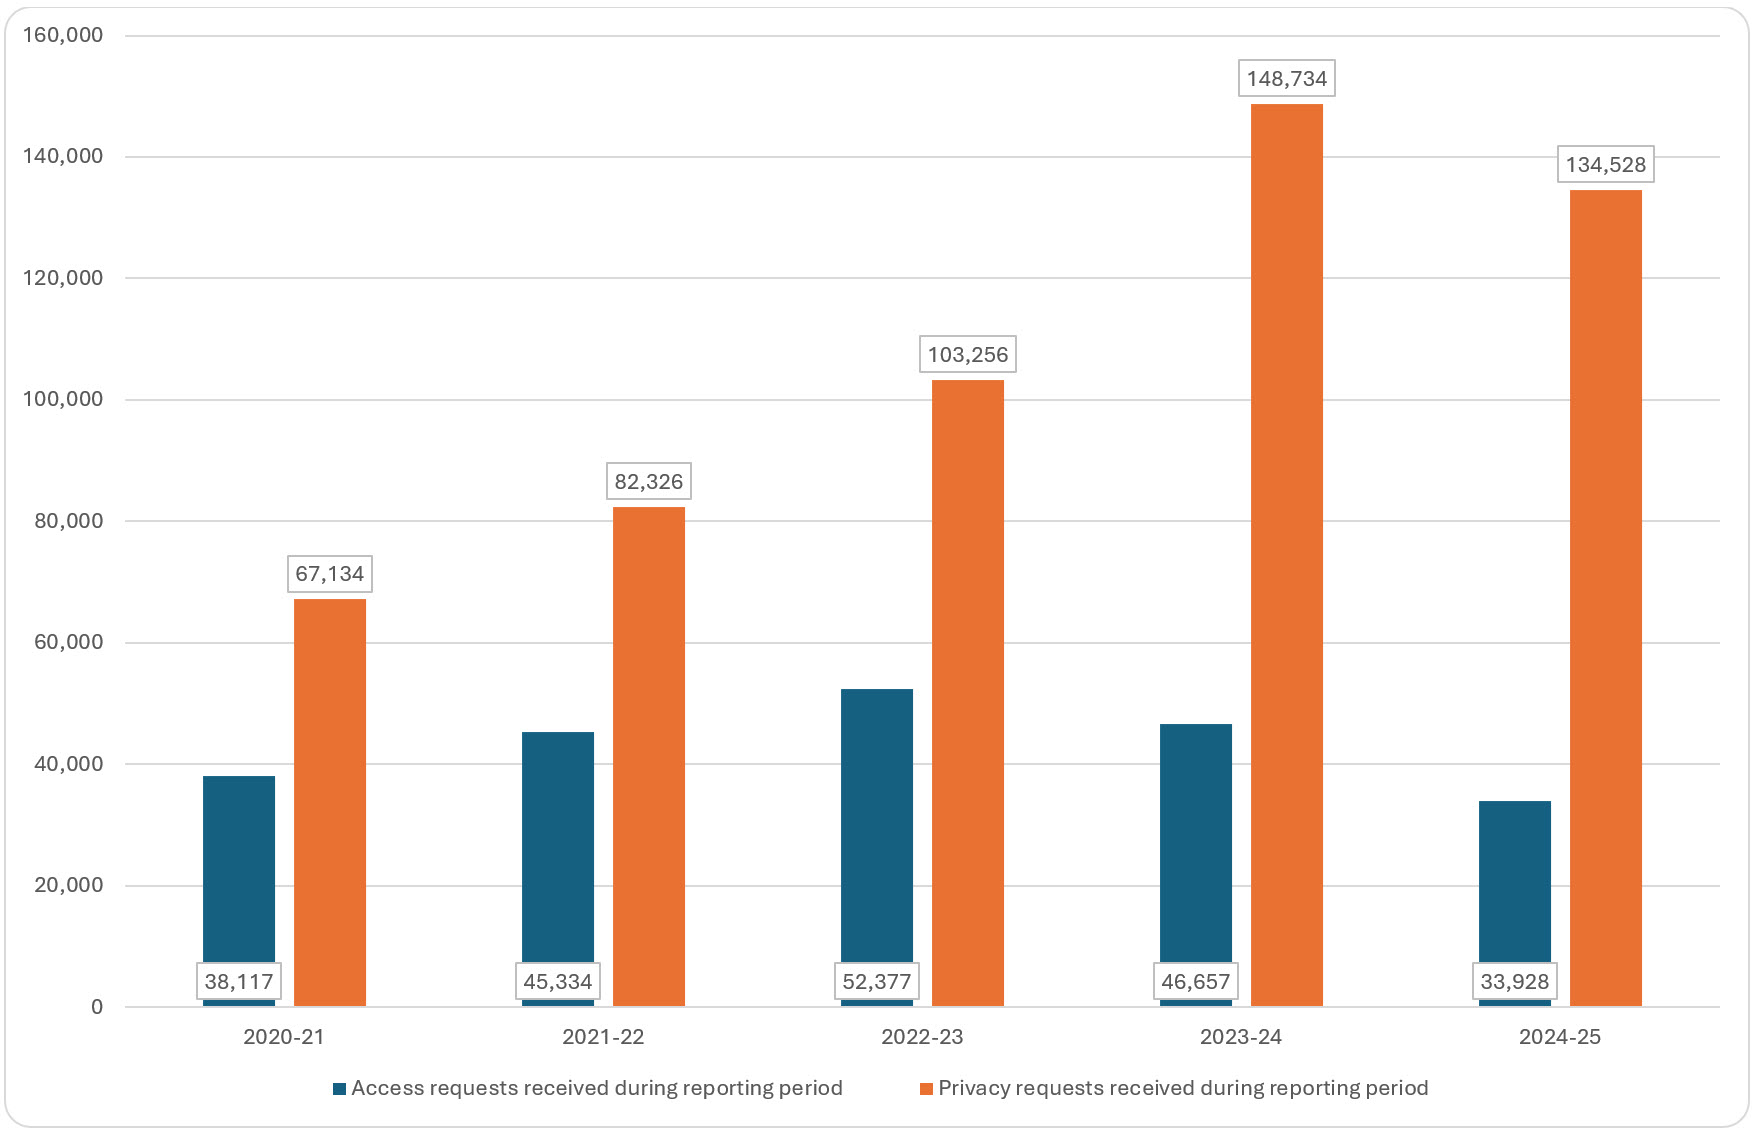
In July 2022, the Government of Canada extended the right of access under the Privacy Act to all individuals, regardless of immigration status, allowing anyone in the world to request their personal information. This change helps explain the growth in requests from foreign nationals. In 2024-25, excluding IRCC, 15,728 personal information requests were received from foreign nationals outside Canada.
Figure 7: Privacy and access requests received (including IRCC), 2020-21 to 2024-25
Text version
| Privacy and access requests received (including IRCC), 2020-21 to 2024-25 | 2020-21 | 2021-22 | 2022-23 | 2023-24 | 2024-25 |
|---|---|---|---|---|---|
Access requests received during reporting period | 145,962 | 222,807 | 236,964 | 229,564 | 202,915 |
Privacy requests received during reporting period | 86,491 | 109,132 | 127,420 | 218,454 | 236,069 |
Figure 8: Privacy and access requests received (excluding IRCC), 2020-21 to 2024-25
Text version
| Privacy and access requests received (excluding IRCC), 2020-21 to 2024-25 | 2020-21 | 2021-22 | 2022-23 | 2023-24 | 2024-25 |
|---|---|---|---|---|---|
Access requests received during reporting period | 38,117 | 45,334 | 52,377 | 46,657 | 33,928 |
Privacy requests received during reporting period | 67,134 | 82,326 | 103,256 | 148,734 | 134,528 |
Request completion time
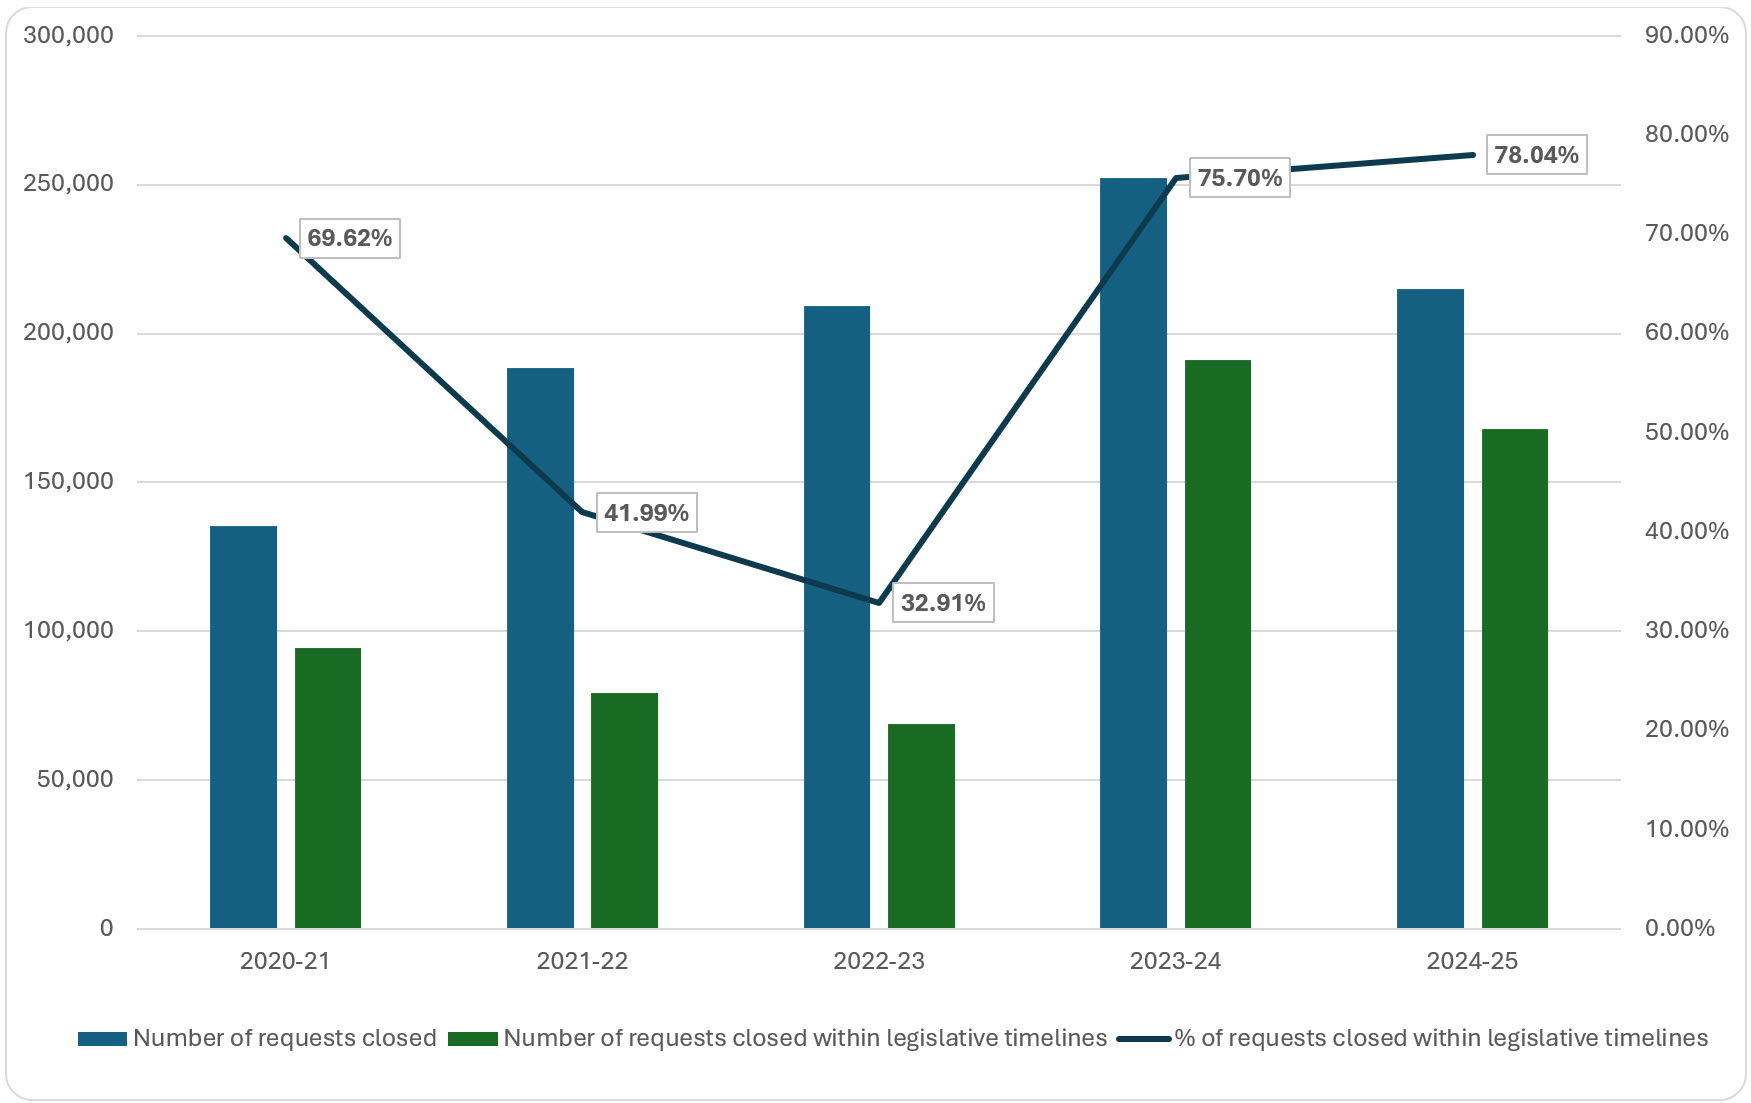
IRCC’s high rate of responding to requests within legislated timelinesFootnote 1 continued to significantly impacts overall compliance rates. In 2024-25, 22% of all access requests were not responded to within legislated timelines. This is a 2.34% improvement from the previous year.
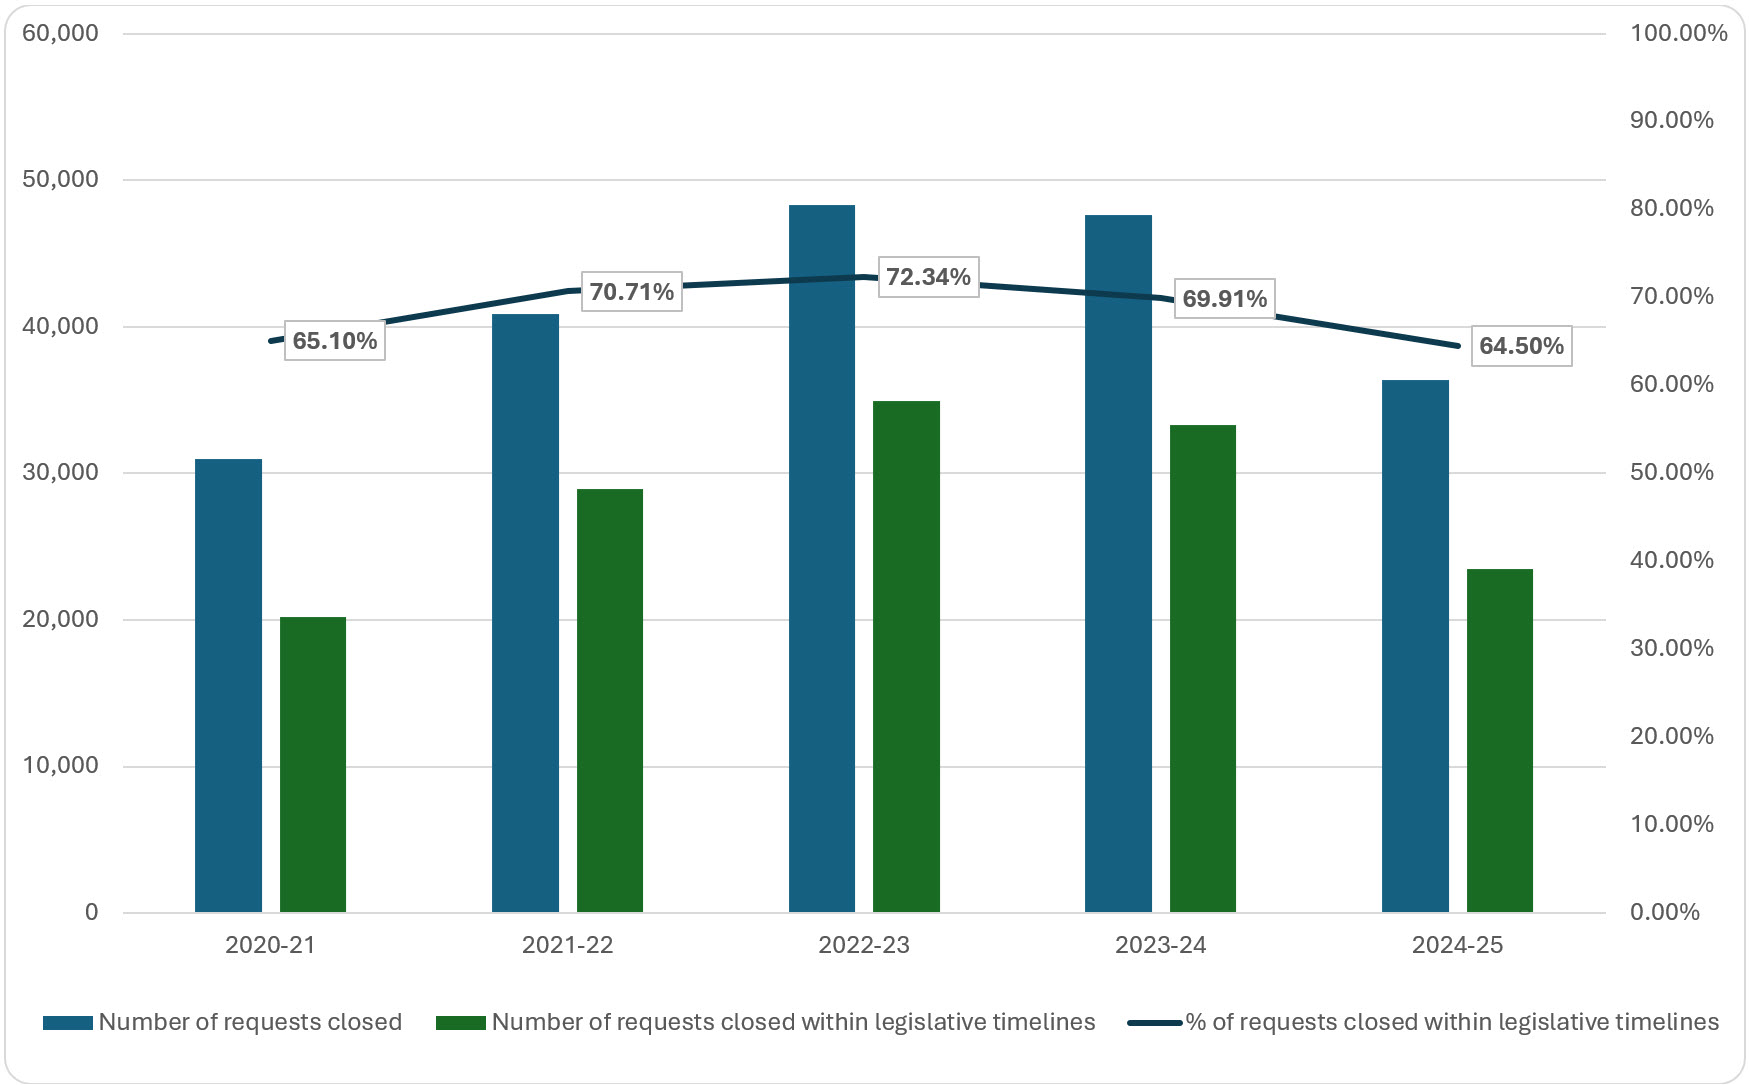
When excluding IRCC:
- 35.5% of access requests were not responded to within legislated timelines, a 5.4% decrease from the previous year.
- Just over one third of access to information requests (38.8%) were responded to within 30 days, a decrease of nearly 8% compared to 2023-24.
Figure 9: Percentage of access requests closed within legislated timelines (including IRCC), 2020-21 to 2024-25
Text version
| Percentage of access to information requests closed within legislated timelines (including IRCC), 2020-21 to 2024-25 | Number of requests closed | Number of requests closed within legislative timelines | % of requests closed within legislative timelines |
|---|---|---|---|
2020-21 | 135,536 | 94,359 | 69.62% |
2021-22 | 188,601 | 79,189 | 41.99% |
2022-23 | 209,375 | 68,904 | 32.91% |
2023-24 | 252,406 | 191,061 | 75.70% |
2024-25 | 215,029 | 167,800 | 78.04% |
Figure 10: Percentage of access requests closed within legislated timelines (excluding IRCC), 2020-21 to 2024-25
Text version
| Percentage of access to information requests closed within legislated timelines (excluding IRCC), 2020-21 to 2024-25 | Number of requests closed | Number of requests closed within legislative timelines | % of requests closed within legislative timelines |
|---|---|---|---|
2020-21 | 30,989 | 20,175 | 65.10% |
2021-22 | 40,889 | 28,913 | 70.71% |
2022-23 | 48,308 | 34,947 | 72.34% |
2023-24 | 47,644 | 33,309 | 69.91% |
2024-25 | 36,361 | 23,453 | 64.50% |
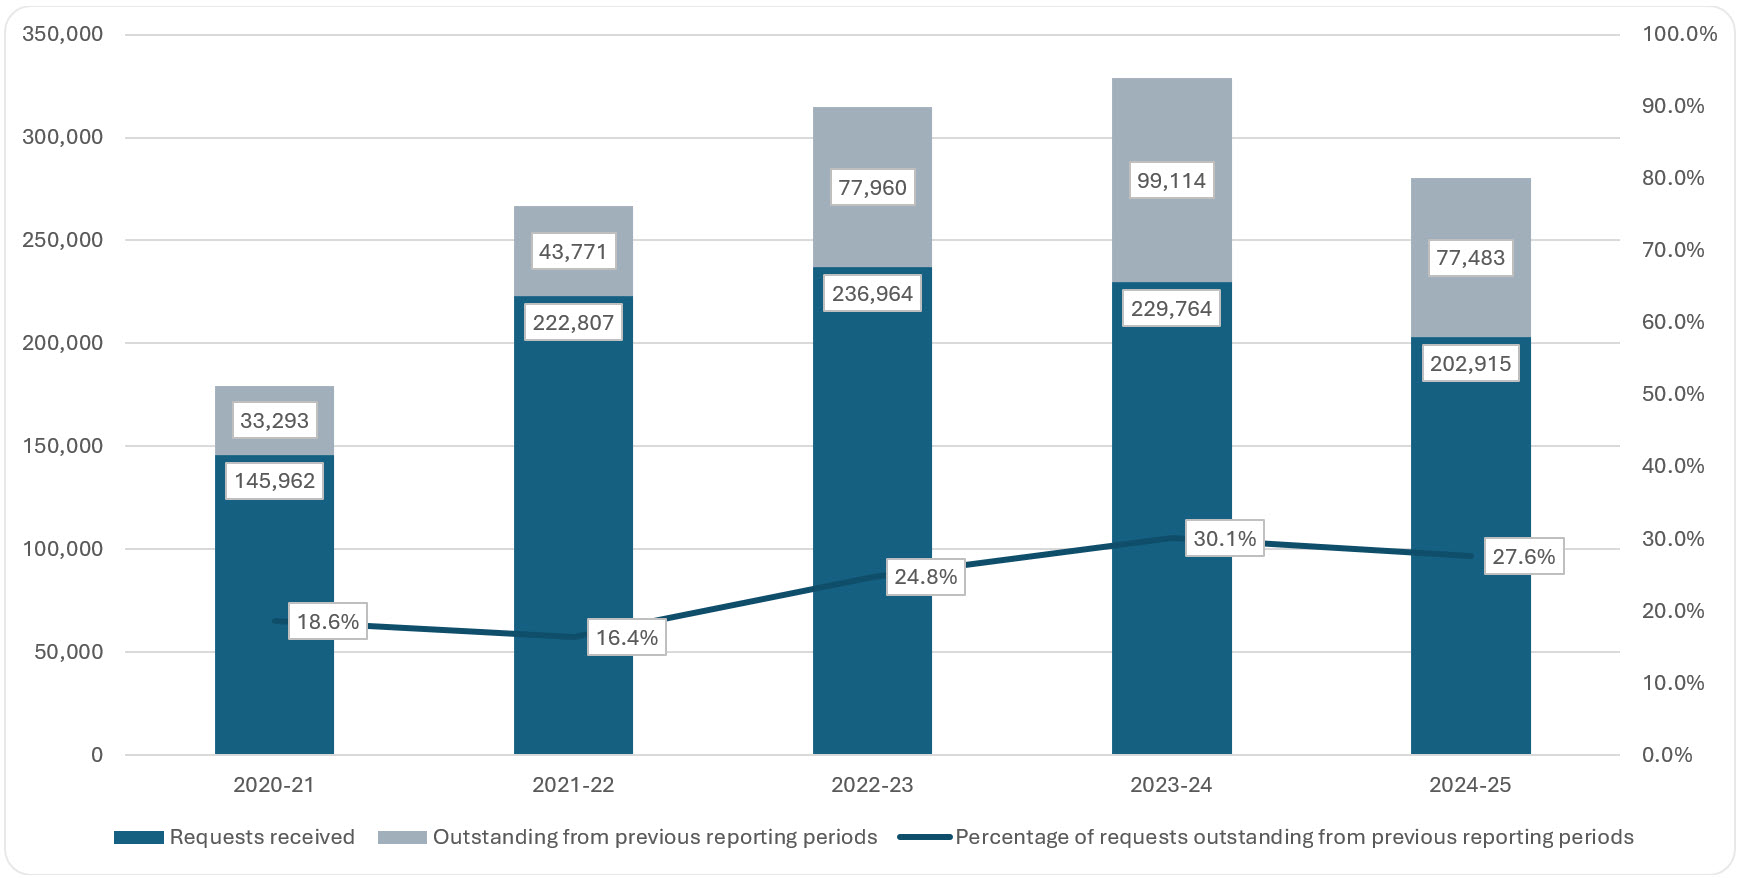
Requests carried over
Across all institutions, including IRCC, 27.6% of access requests were carried over in 2024-25. Both the number of requests received and the proportion of requests carried over decreased slightly, which may indicate modest improvements in inventory management.
Figure 11: Access to information requests received during reporting period and outstanding from previous reporting periods, 2020-21 to 2024-25
Text version
| Access to information requests received during reporting period and outstanding from previous reporting periods, 2020-21 to 2024-25 | 2020-21 | 2021-22 | 2022-23 | 2023-24 | 2024-25 |
|---|---|---|---|---|---|
Requests received | 145,962 | 222,807 | 236,964 | 229,764 | 202,915 |
Outstanding from previous reporting periods | 33,293 | 43,771 | 77,960 | 99,114 | 77,483 |
Percentage of requests outstanding from previous reporting periods | 18.6% | 16.4% | 24.8% | 30.1% | 27.6% |
Backlogs
Composition of backlogs
As of March 31, 2025, 65,388 access to information requests were carried over across institutions, with 65% beyond legislated timelines. Of these late requests, 40% were received in 2024-25, while 2023-24 and 2022-23 together account for approximately 44%.
Longstanding backlogs
At the start of 2024-25, over half (51.4%) of requests carried over had been outstanding for two fiscal years or more. Some institutions had particularly high proportions of older requests, with a large volume of requests carried over for two years or more including:
- Windsor-Detroit Bridge Authority (93.2%)
- Immigration and Refugee Board (83.3%)
- Office of the Chief Electoral Officer (78.9%)
- Public Health Agency of Canada (77.6%)
Growth of backlogs
About 8% of institutions carried over more requests to 2025-26 than they closed in 2024-25. These include:
- Communication Security Establishment
- Crown-Indigenous Relations and Northern Affairs Canada
- Department of Justice
- Environment and Climate Change Canada
- Innovation, Science and Economic Development Canada
- National Defence
- Privy Council Office
- Public Safety Canada
Institution-specific request trends
Library and Archives Canada
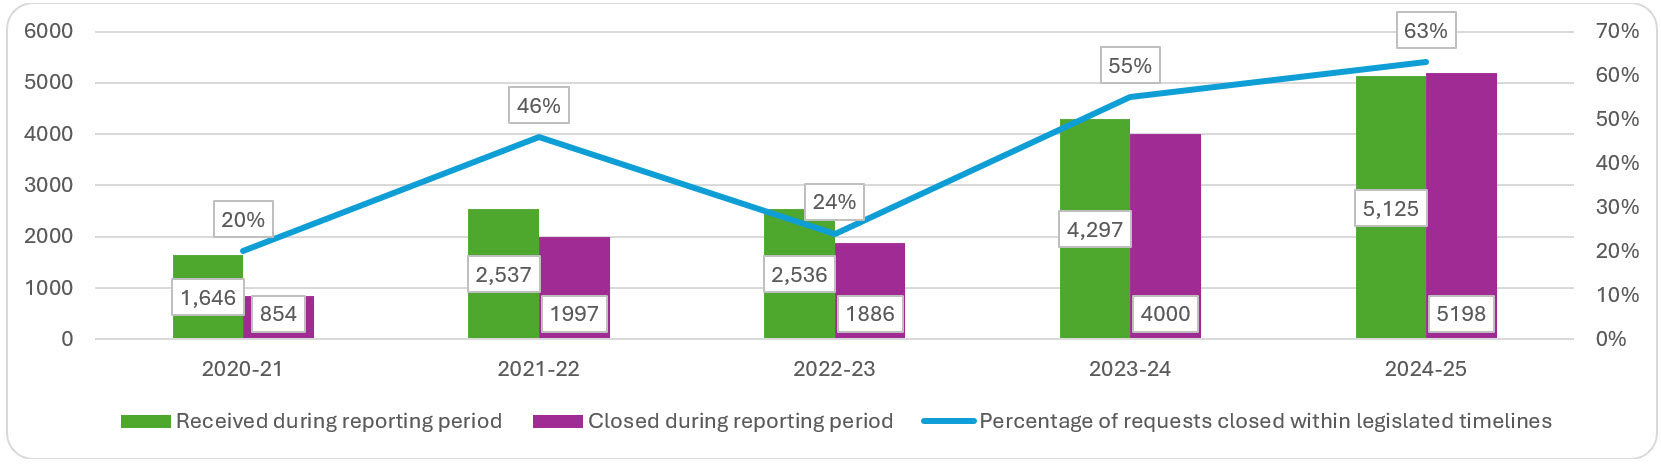
The 2024-25 data shows that Library and Archives Canada (LAC) made positive progress in responding to access requests within legislated timelines. In 2024-25, the institution closed 63% of its requests within legislated timelines, its highest compliance rate over the last five years. LAC was also able to keep the number of requests carried over stable despite a 21% increase in the number of requests received, a 30% increase in the number of requests closed and an 80% increase in the number of pages reviewed. LAC’s annual report notes that the temporary funding provided to increase its ATI response capacity significantly contributed to these results.
Subsection 19(1) (personal privacy) and subsection 24(1) (statutory prohibitions against disclosure) were the most frequently applied exemptions in 2024-25.
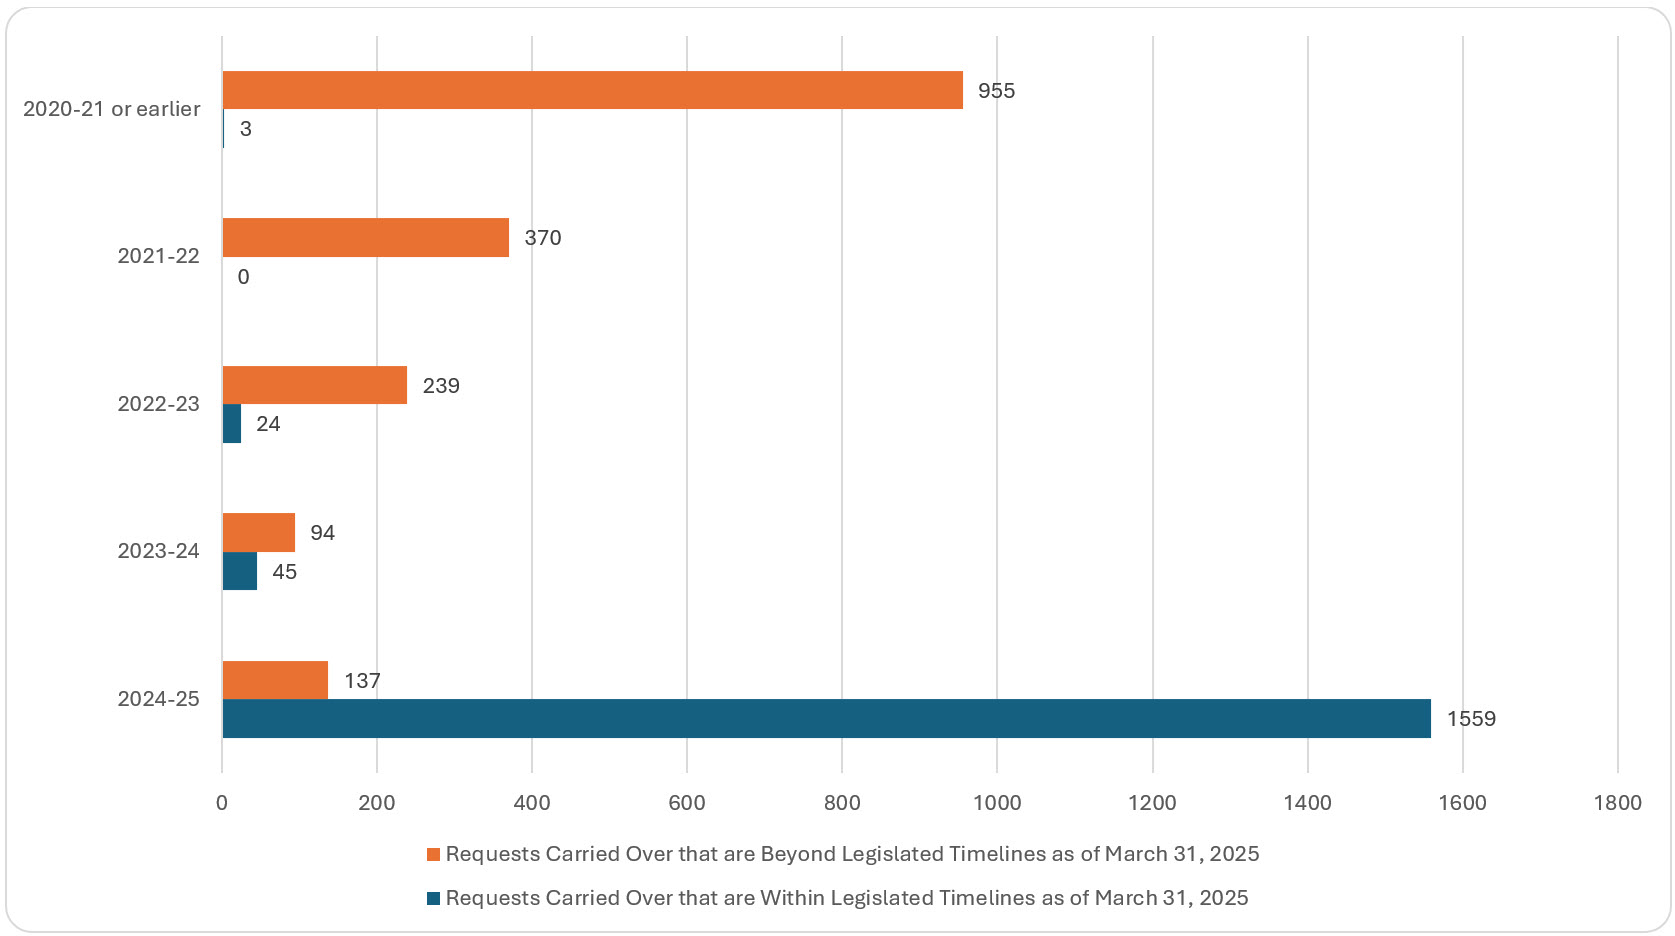
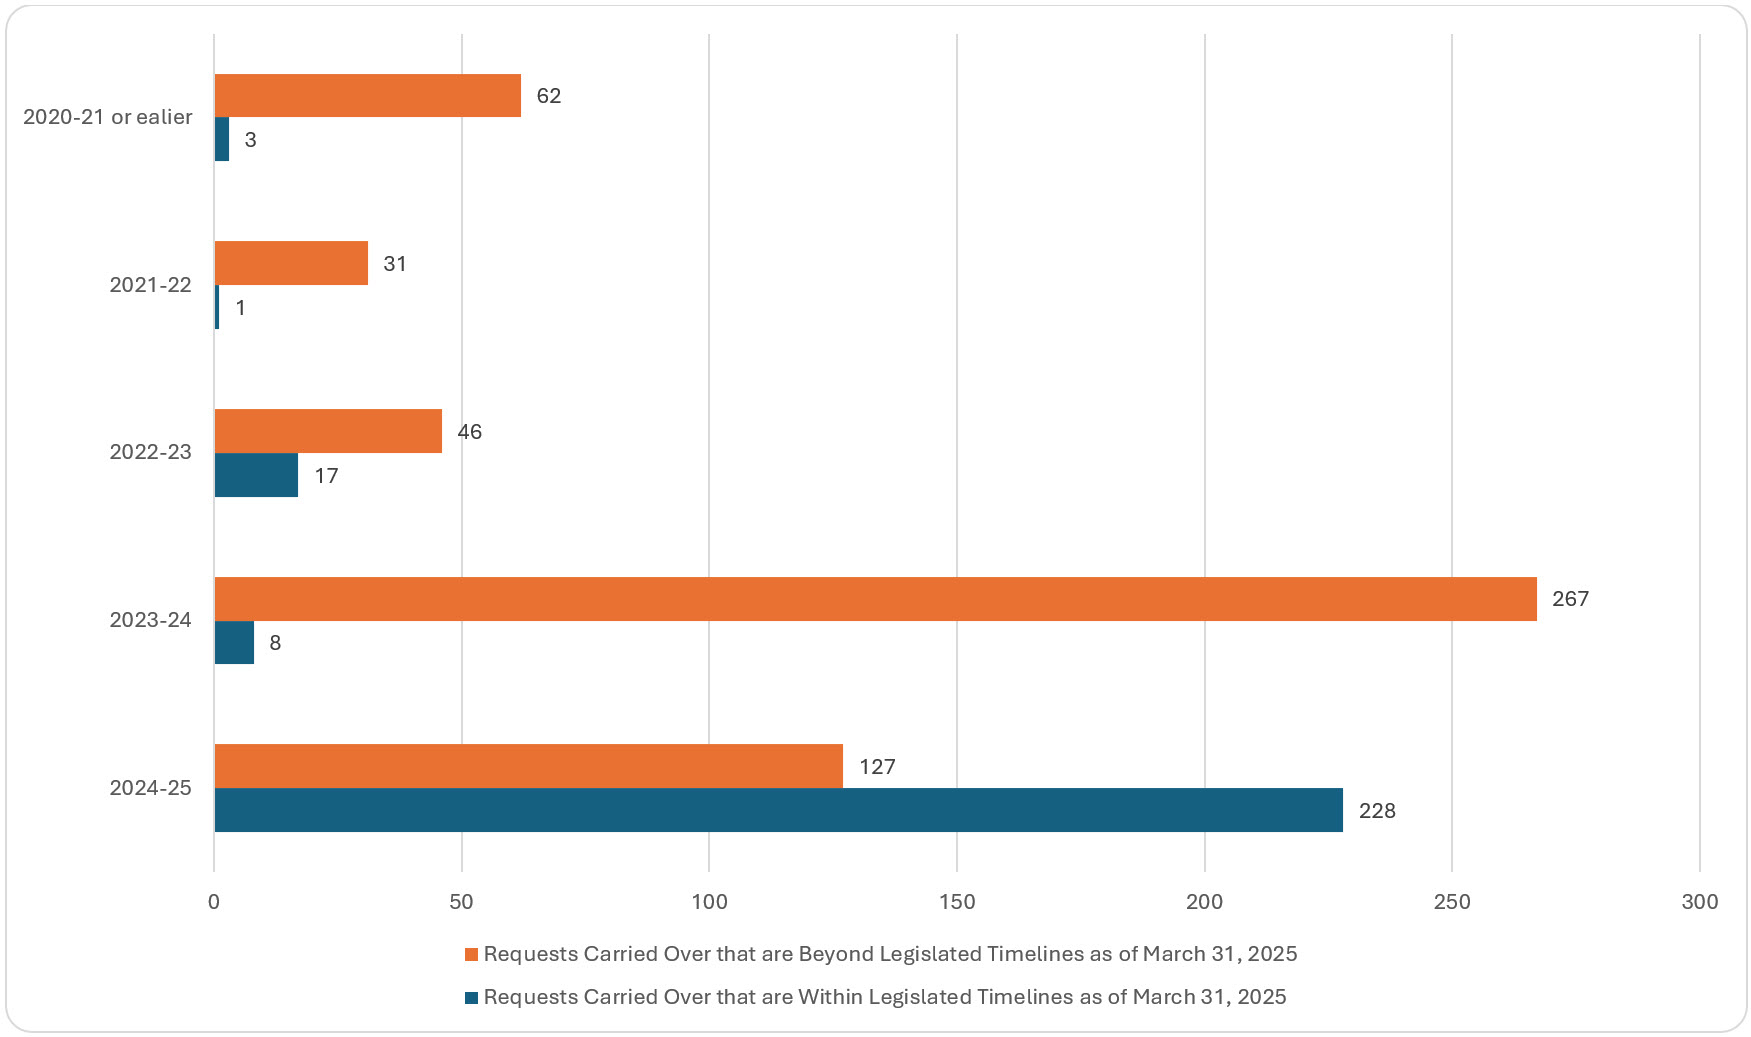
When it comes to its backlog, LAC stands out as legacy-heavy: more than half (53%) of its carried over requests that are beyond legislated timelines date from 2020-21 or before. Just over half of LAC’s backlog (54%) was received in the last two fiscal years (2023-24 and 2024-25), while 28% dates from 2020-21 or earlier.
Figure 12: Requests received and closed by LAC, including the percentage of requests closed within legislated timelines, 2020-21 to 2024-25
Text version
| Requests closed and received by LAC, including the percentage of requests closed within legislated timelines, 2020-21 to 2024-25 | Received during reporting period | Closed during reporting period | Percentage of requests closed within legislated timelines |
|---|---|---|---|
2020-21 | 1,646 | 854 | 20% |
2021-22 | 2,537 | 1,997 | 46% |
2022-23 | 2,536 | 1,886 | 24% |
2023-24 | 4,297 | 4,000 | 55% |
2024-25 | 5,125 | 5,198 | 63% |
Figure 13: Requests carried over by LAC, within and beyond legislated timelines, 2020-21 or earlier to 2024-25
Text version
| Requests carried over by LAC, within and beyond legislated timelines, 2020-21 or earlier to 2024-25 | Requests Carried Over that are Within Legislated Timelines as of March 31, 2025 | Requests Carried Over that are Beyond Legislated Timelines as of March 31, 2025 |
|---|---|---|
2024-25 | 1,559 | 137 |
2023-24 | 45 | 94 |
2022-23 | 24 | 239 |
2021-22 | 0 | 370 |
2020-21 or earlier | 3 | 955 |
Department of National Defence
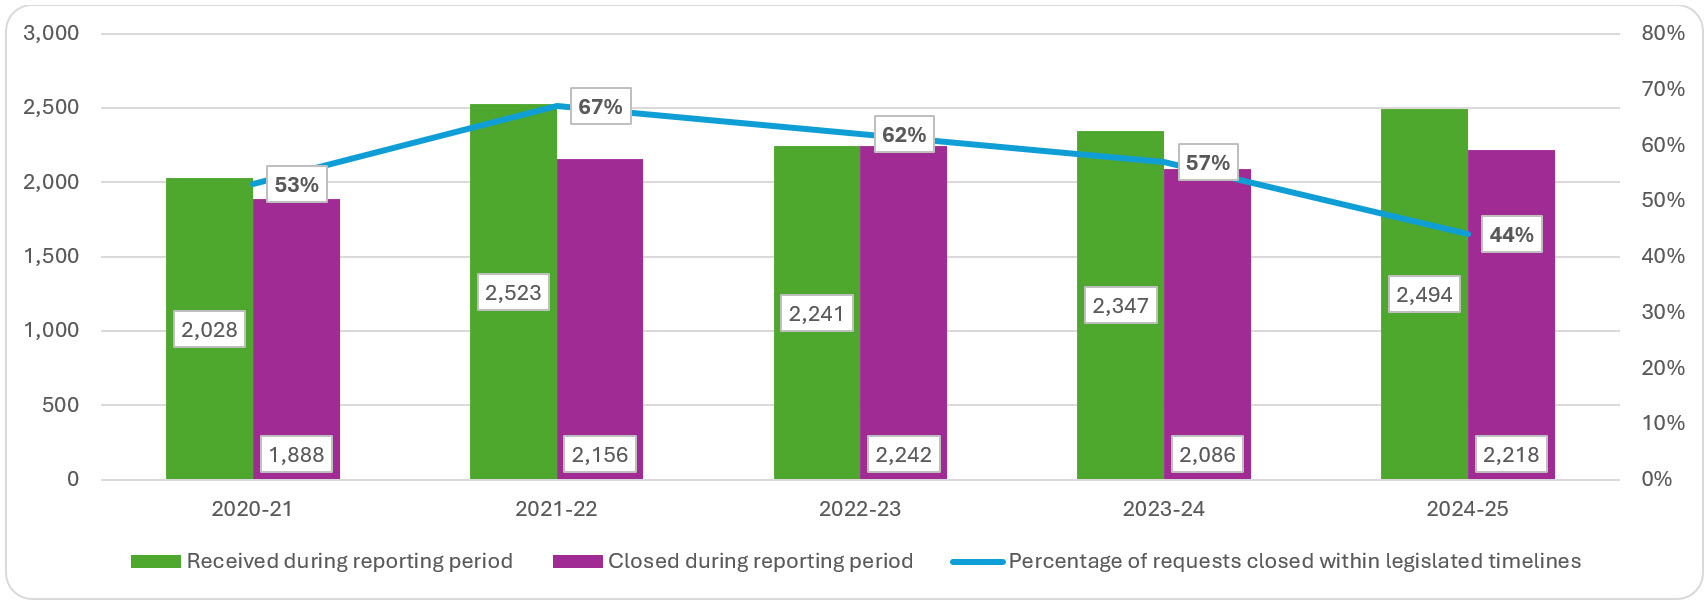
The 2024-25 data show that the Department of National Defence (DND) continued to face challenges in responding to access requests within legislated timelines. In 2024-25, the institution closed 44% of its access to information requests within legislated timelines, the lowest compliance rate over the last five years. Of note, the number of pages processed by DND increased by 40.3% in 2024-25.
The 2024-25 data indicates that DND’s most frequently applied exemptions were subsection 15(1) (international relations or national defence) and subsection 19(1) (personal privacy).
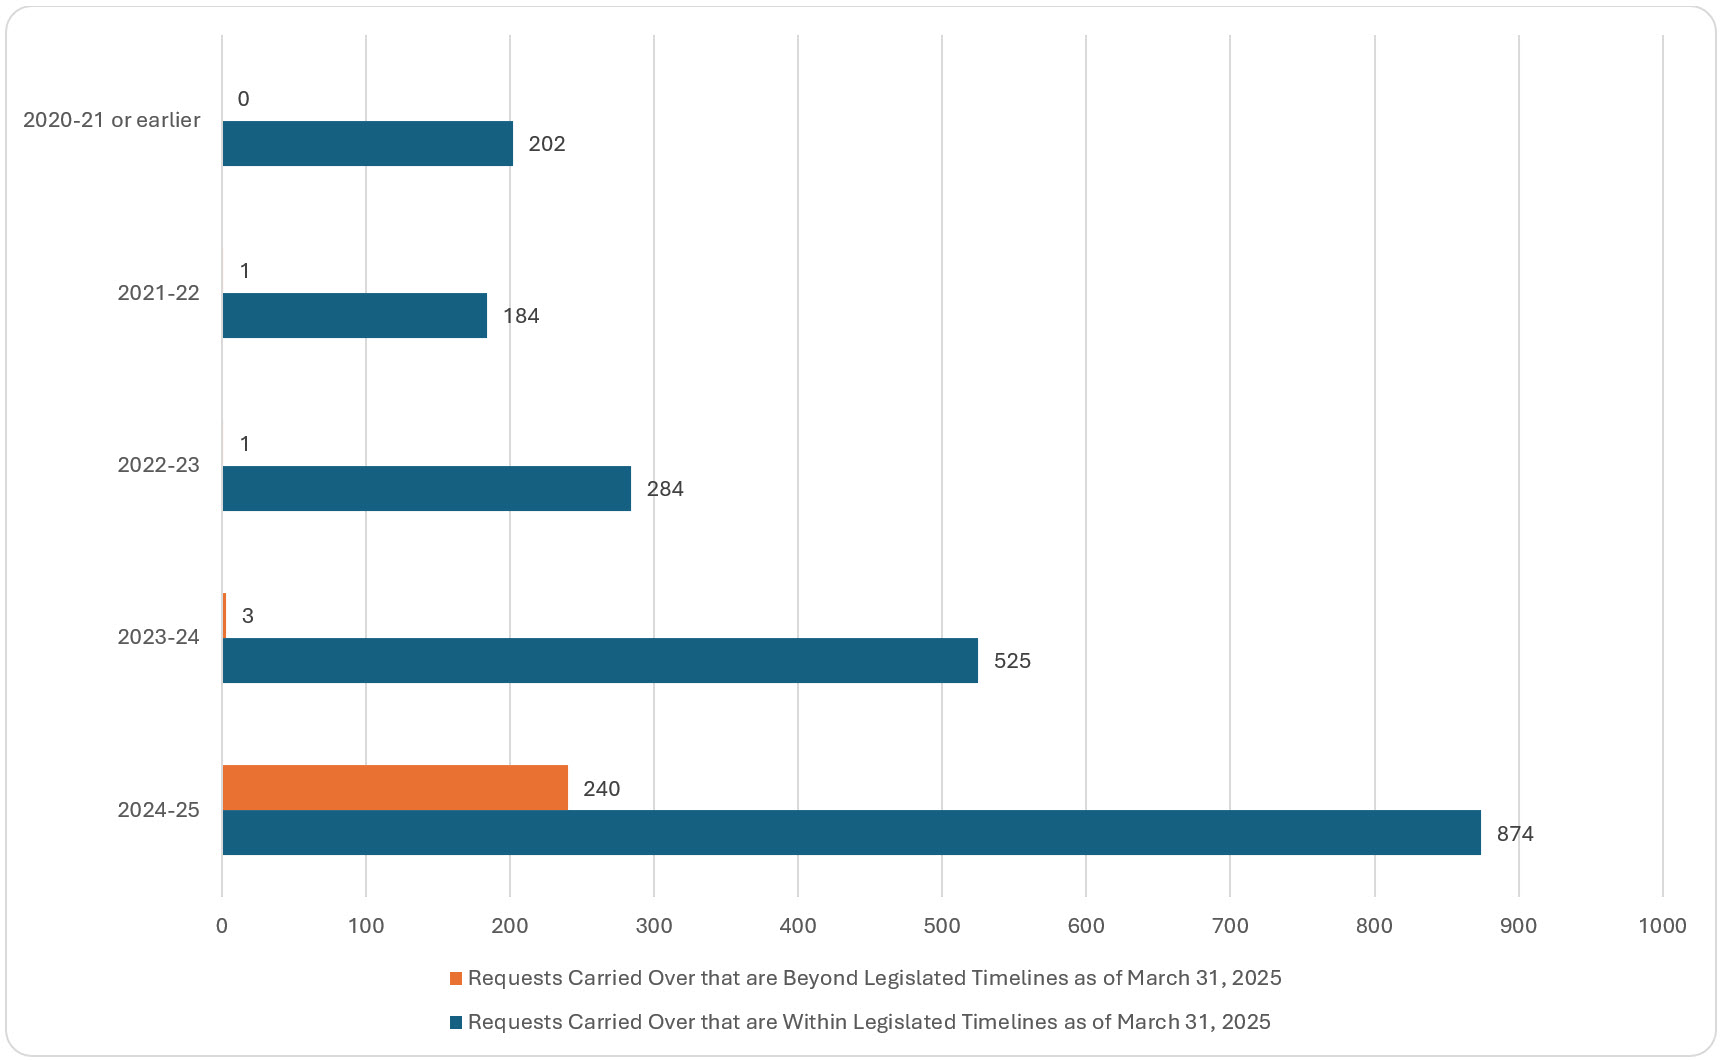
In 2024-25, 71% of DND’s outstanding requests were received within the last two fiscal years (2023-24 and 2024-25), while approximately 9% were more than four years old. The majority of DND’s backlog (89%) remains within legislated timelines.
Figure 14: Requests received and closed by DND, including the percentage of requests closed within legislated timelines, 2020-21 to 2024-25
Text version
| Requests closed and received by DND, including the percentage of requests closed within legislated timelines, 2020-21 to 2024-25 | Received during reporting period | Closed during reporting period | Percentage of requests closed within legislated timelines |
|---|---|---|---|
2020-21 | 2,028 | 1,888 | 53 |
2021-22 | 2,523 | 2,156 | 67 |
2022-23 | 2,241 | 2,242 | 62 |
2023-24 | 2,347 | 2,086 | 57 |
2024-25 | 2,494 | 2,218 | 44 |
Figure 15: Requests carried over by DND, within and beyond legislated timelines, 2020-21 or earlier to 2024-25
Text version
| Requests carried over by DND, within and beyond legislated timelines, 2020-21 or earlier to 2024-25 | Requests Carried Over that are Within Legislated Timelines as of March 31, 2025 | Requests Carried Over that are Beyond Legislated Timelines as of March 31, 2025 |
|---|---|---|
2024-25 | 874 | 240 |
2023-24 | 525 | 3 |
2022-23 | 284 | 1 |
2021-22 | 184 | 1 |
2020-21 or earlier | 202 | 0 |
Privy Council Office
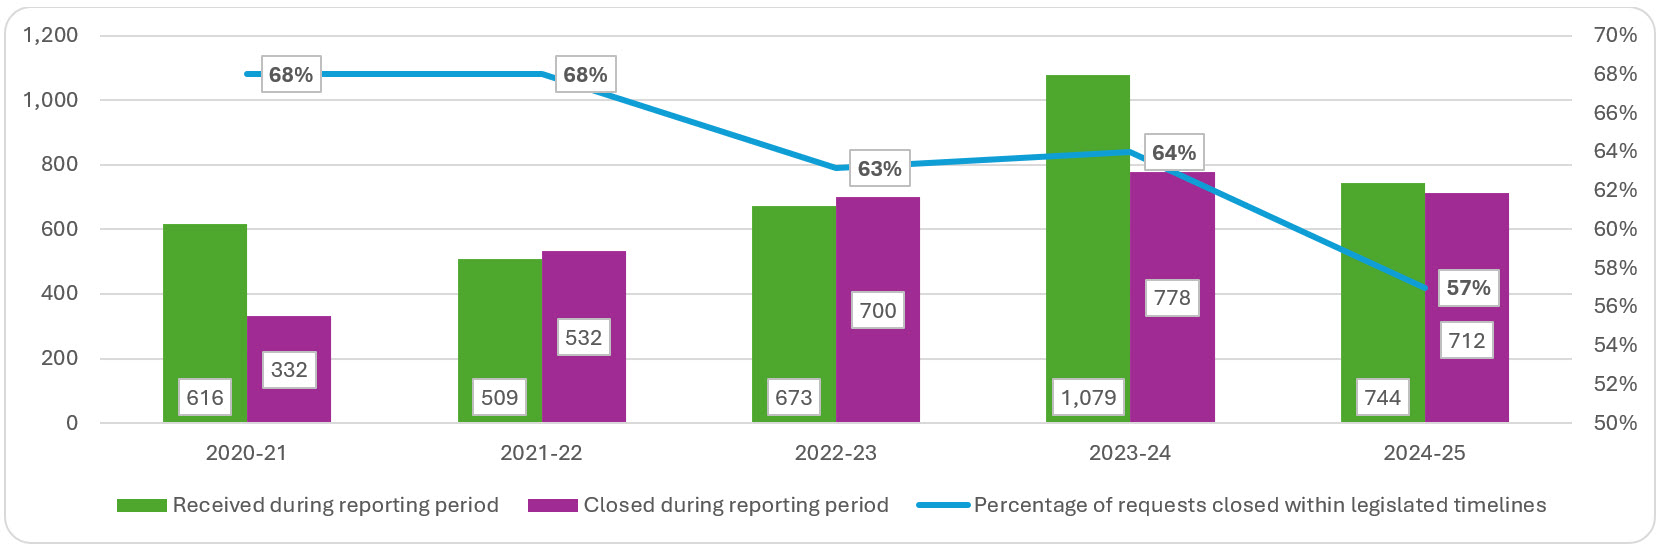
The 2024-25 data show that the Pricy Council Office (PCO) continued to experience a steady decline in the percentage of request closed within legislated timelines. In 2024-25, the institution carried over more requests to the next reporting period than it closed. PCO received 1,990 informal requests, representing a 147.5% increase over the previous year. It also saw a nearly 300% increase in the number of pages processed from the previous reporting period.
The most applied exemptions in 2024-25 were subsection 15(1) (international relations or national defence), paragraph 21(1)(a) (advice or recommendations) and subsection 19(1) (personal privacy). The most frequently applied exclusion was section 69(1)(e), relating to Cabinet confidences.
Approximately 83% of outstanding requests in PCO’s backlog were received within the last two fiscal years (2023-24 and 2024-25). While requests older than four years represent about 5% of the backlog, a concerning 67% of all requests in the backlog are beyond legislated timelines.
Figure 16: Requests received and closed by PCO, including the percentage of requests closed within legislated timelines, 2020-21 to 2024-25
Text version
| Requests closed and received by PCO, including the percentage of requests closed within legislated timelines, 2020-21 to 2024-25 | Received during reporting period | Closed during reporting period | Percentage of requests closed within legislated timelines |
|---|---|---|---|
2020-21 | 616 | 332 | 68 |
2021-22 | 509 | 532 | 68 |
2022-23 | 673 | 700 | 63 |
2023-24 | 1079 | 778 | 64 |
2024-25 | 744 | 712 | 57 |
Figure 17: Requests carried over by PCO, within and beyond legislated timelines, 2020-21 or earlier to 2024-25
Text version
| Requests carried over by PCO, within and beyond legislated timelines, 2020-21 or earlier to 2024-25 | Requests Carried Over that are Within Legislated Timelines as of March 31, 2025 | Requests Carried Over that are Beyond Legislated Timelines as of March 31, 2025 |
|---|---|---|
2024-25 | 228 | 127 |
2023-24 | 8 | 267 |
2022-23 | 17 | 46 |
2021-22 | 1 | 31 |
2020-21 or earlier | 3 | 62 |
Program expenditure and staffing
The average cost per access request processed in 2024-25 was $604.89, up from $514.40 in 2023-24.
Figure 18: Spending on Access to Information program across government, 2020-21 to 2024-25
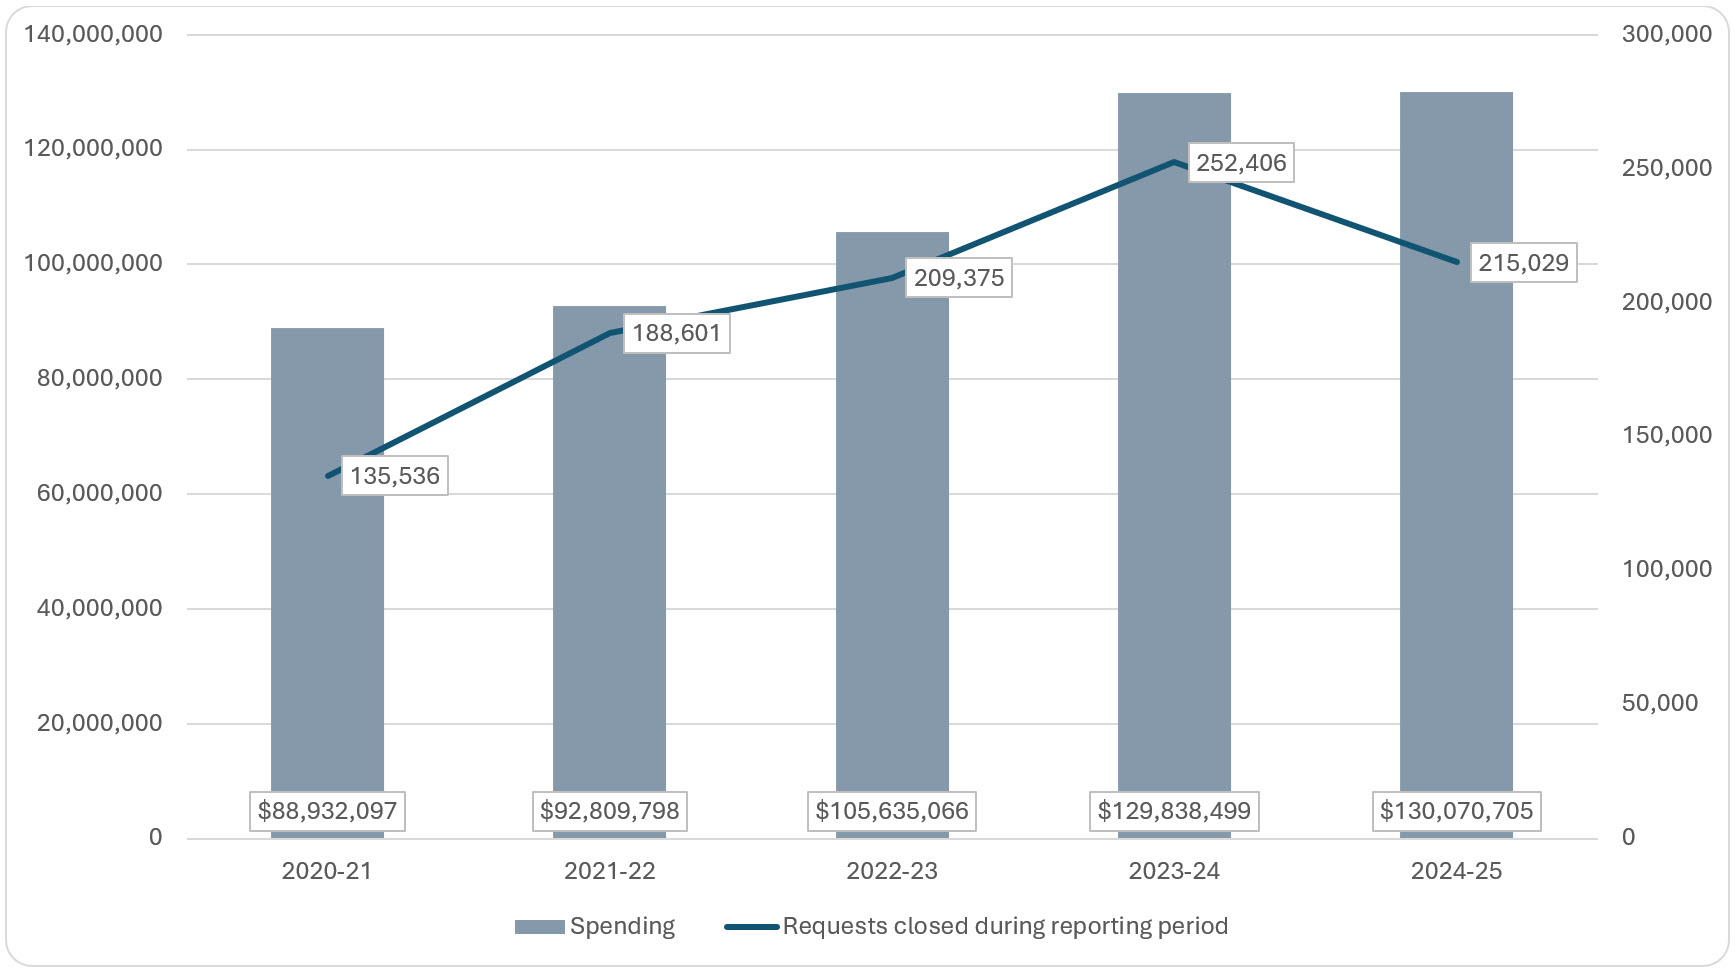
Text version
| Spending on Access to Information program across government, 2020-21 to 2024-25 | Requests closed during reporting period | Spending |
|---|---|---|
2020-21 | 135,536 | 88,932,097 |
2021-22 | 188,601 | 92,809,798 |
2022-23 | 209,375 | 105,635,066 |
2023-24 | 252,406 | 129,838,499 |
2024-25 | 215,029 | 130,070,705 |
Figure 19: Spending on Access to Information program by category across government, 2020-21 to 2024-25 (in millions)
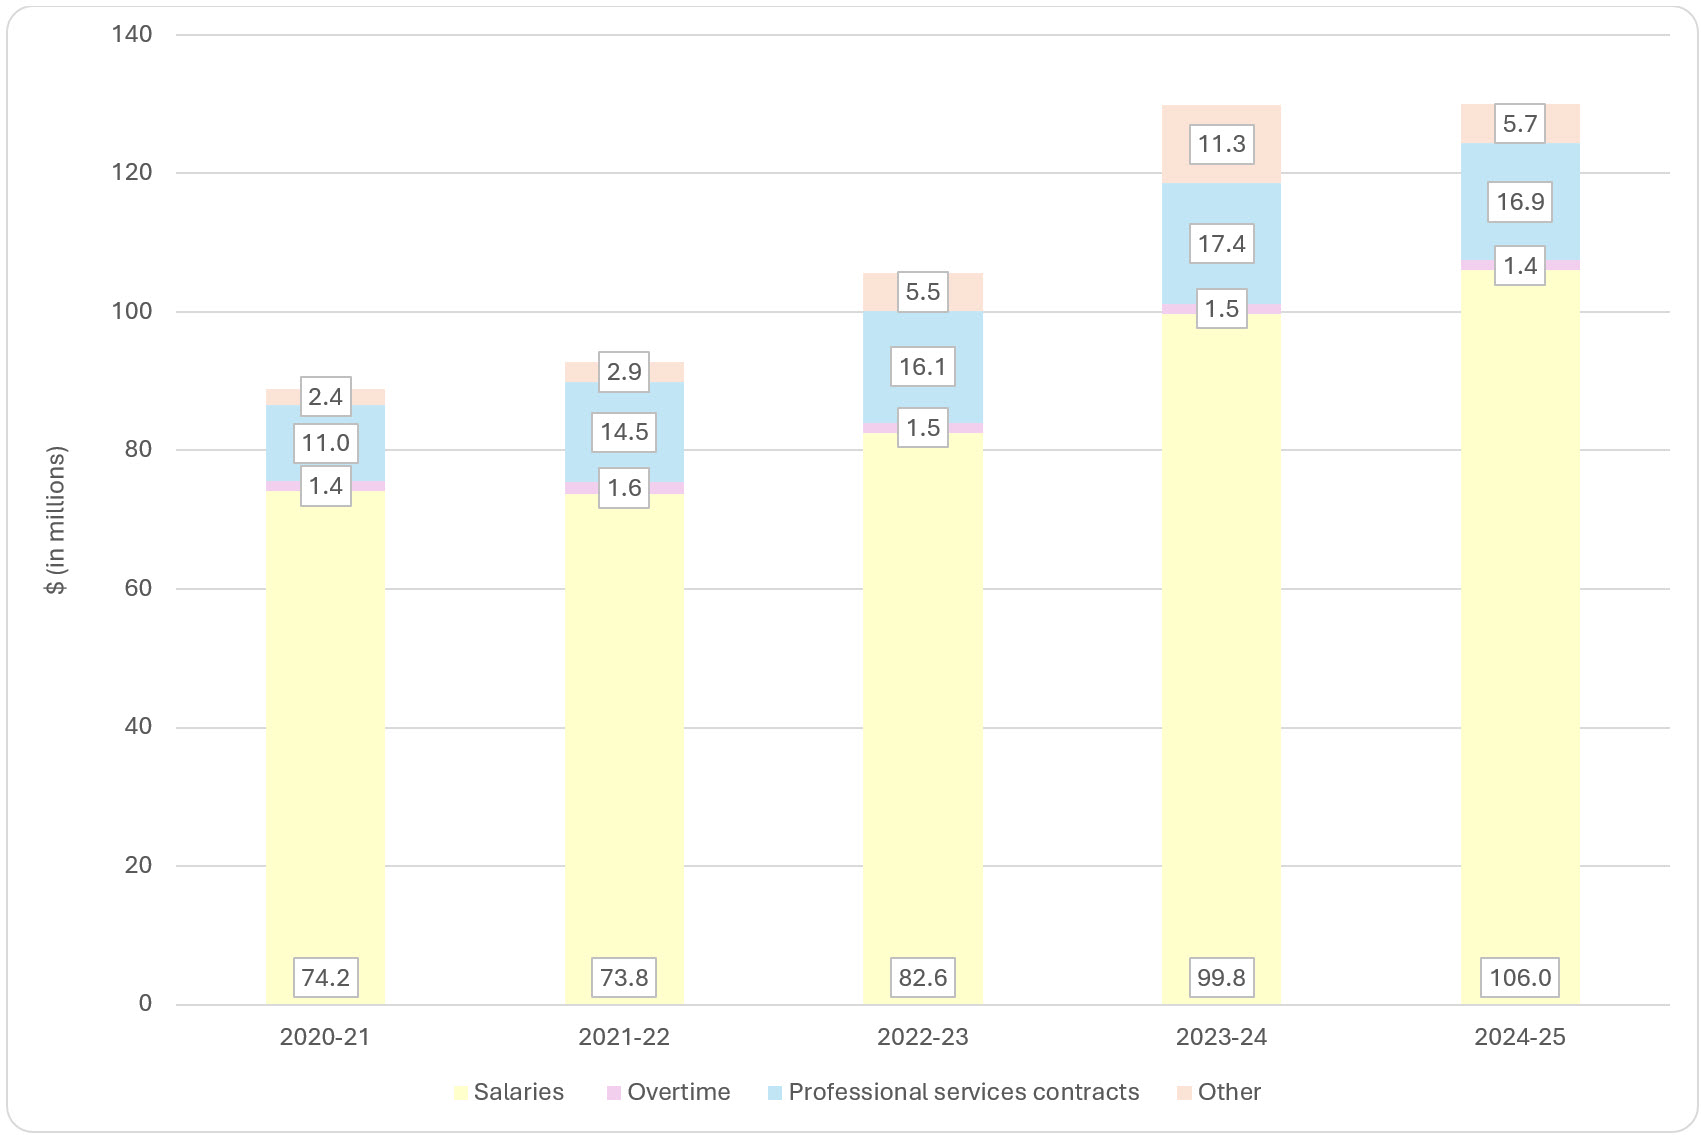
Text version
| Spending on Access to Information program by category across government, 2020-21 to 2024-25) | Salaries | Overtime | Professional services contracts | Other |
|---|---|---|---|---|
2020-21 | 74,197,111 | 1,351,880 | 11,028,477 | 2,354,629 |
2021-22 | 73,758,288 | 1,643,990 | 14,459,470 | 2,948,050 |
2022-23 | 82,553,123 | 1,469,348 | 16,116,613 | 5,495,982 |
2023-24 | 99,766,907 | 1,450,435 | 17,352,163 | 11,268,994 |
2024-25 | 105,997,214 | 1,433,943 | 16,889,775 | 5,749,773 |
Staffing
For the 2024-25 reporting period, spending on access to information programs increased slightly (0.18%) compared with the previous year.
During the same period, the number of person-years dedicated to access to information activities reached its highest level in the last five years, reflecting an upward trend in staffing. This represents a 23.8% increase since 2020-21 and a 4.2% increase compared with the previous reporting year. As in prior years, salaries continue to account for the largest share of expenditures.
Figure 20: Person-years dedicated to access to information activities, 2020-21 to 2024-25
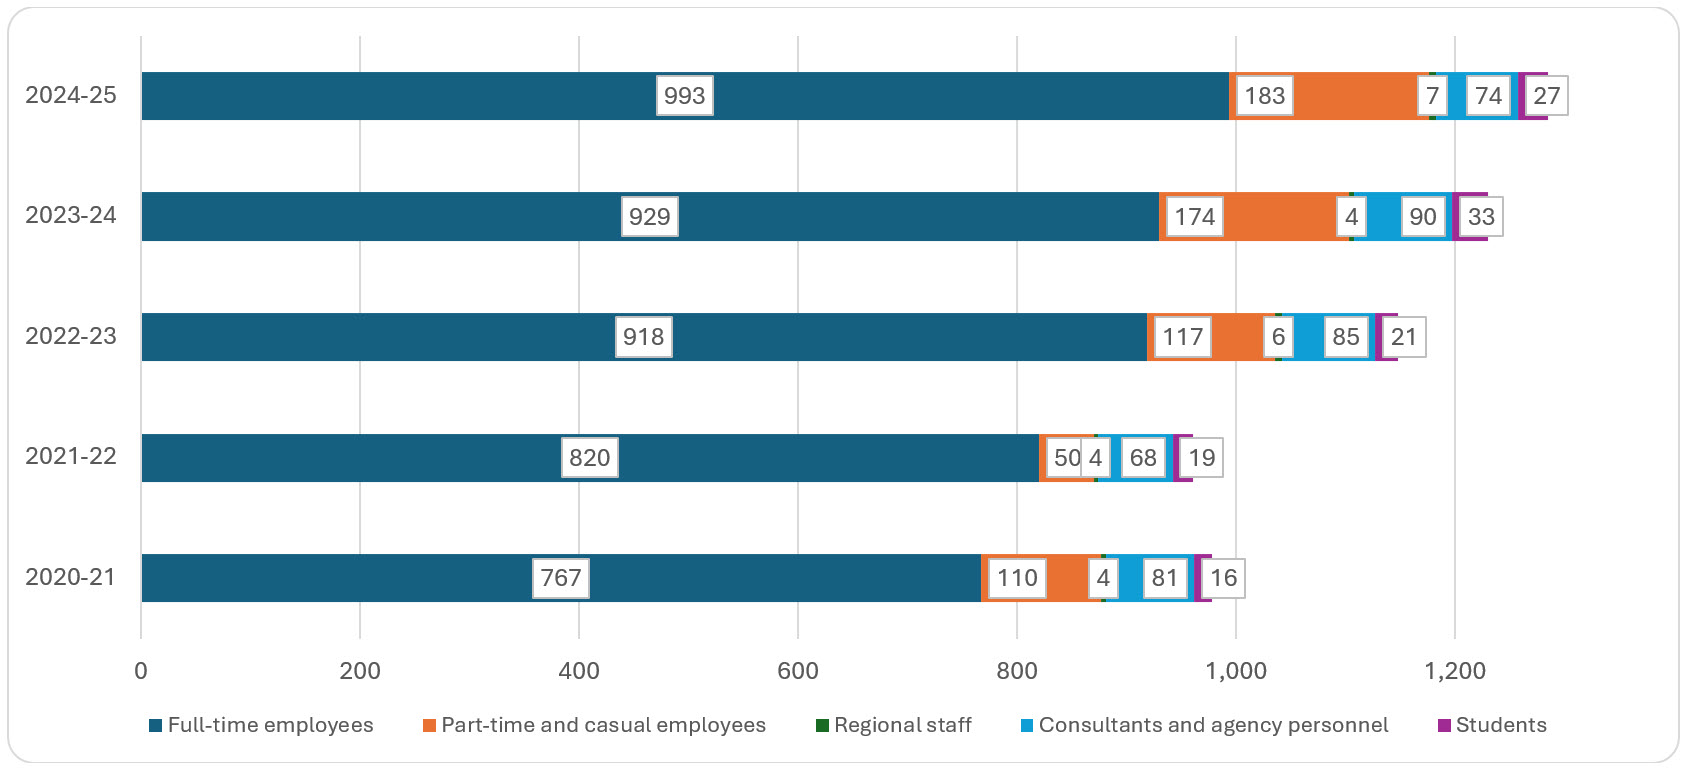
*Rounded to the nearest whole number.
Text version
| Person-years dedicated to access to information activities, 2020-21 to 2024-25 | 2020-21 | 2021-22 | 2022-23 | 2023-24 | 2024-25 |
|---|---|---|---|---|---|
Full-time employees | 767 | 820 | 918 | 929 | 993 |
Part-time and casual employees | 110 | 50 | 117 | 174 | 183 |
Regional staff | 4 | 4 | 6 | 4 | 7 |
Consultants and agency personnel | 81 | 68 | 85 | 90 | 74 |
Students | 16 | 19 | 21 | 33 | 27 |
Requests and complaints
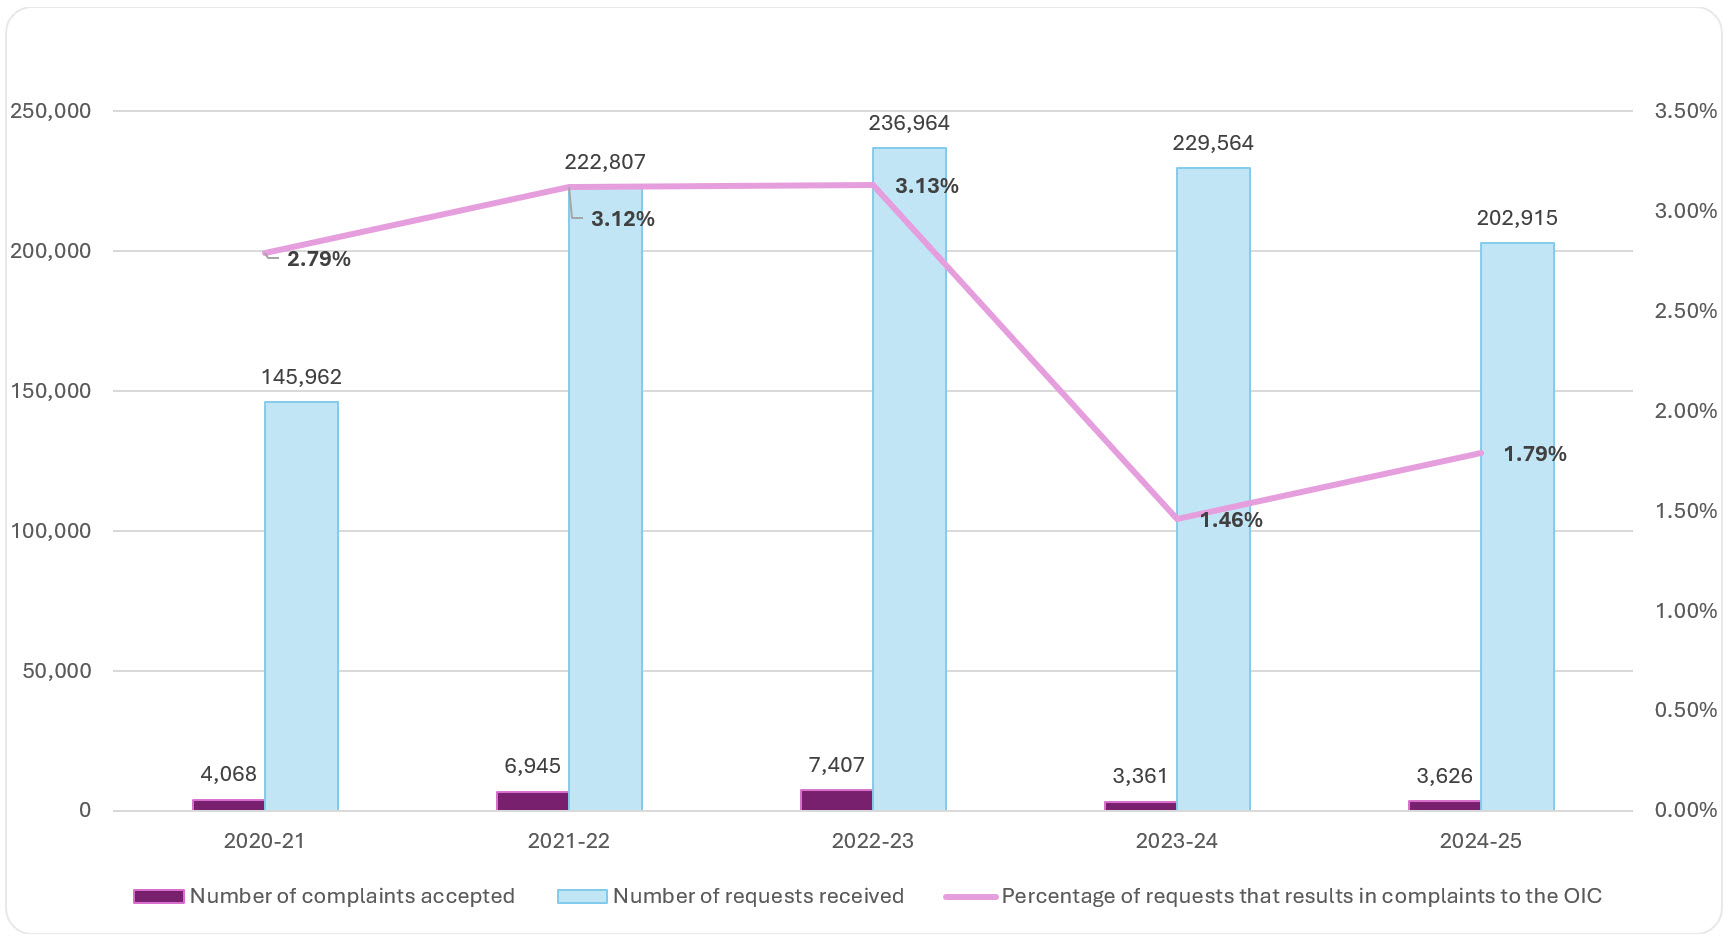
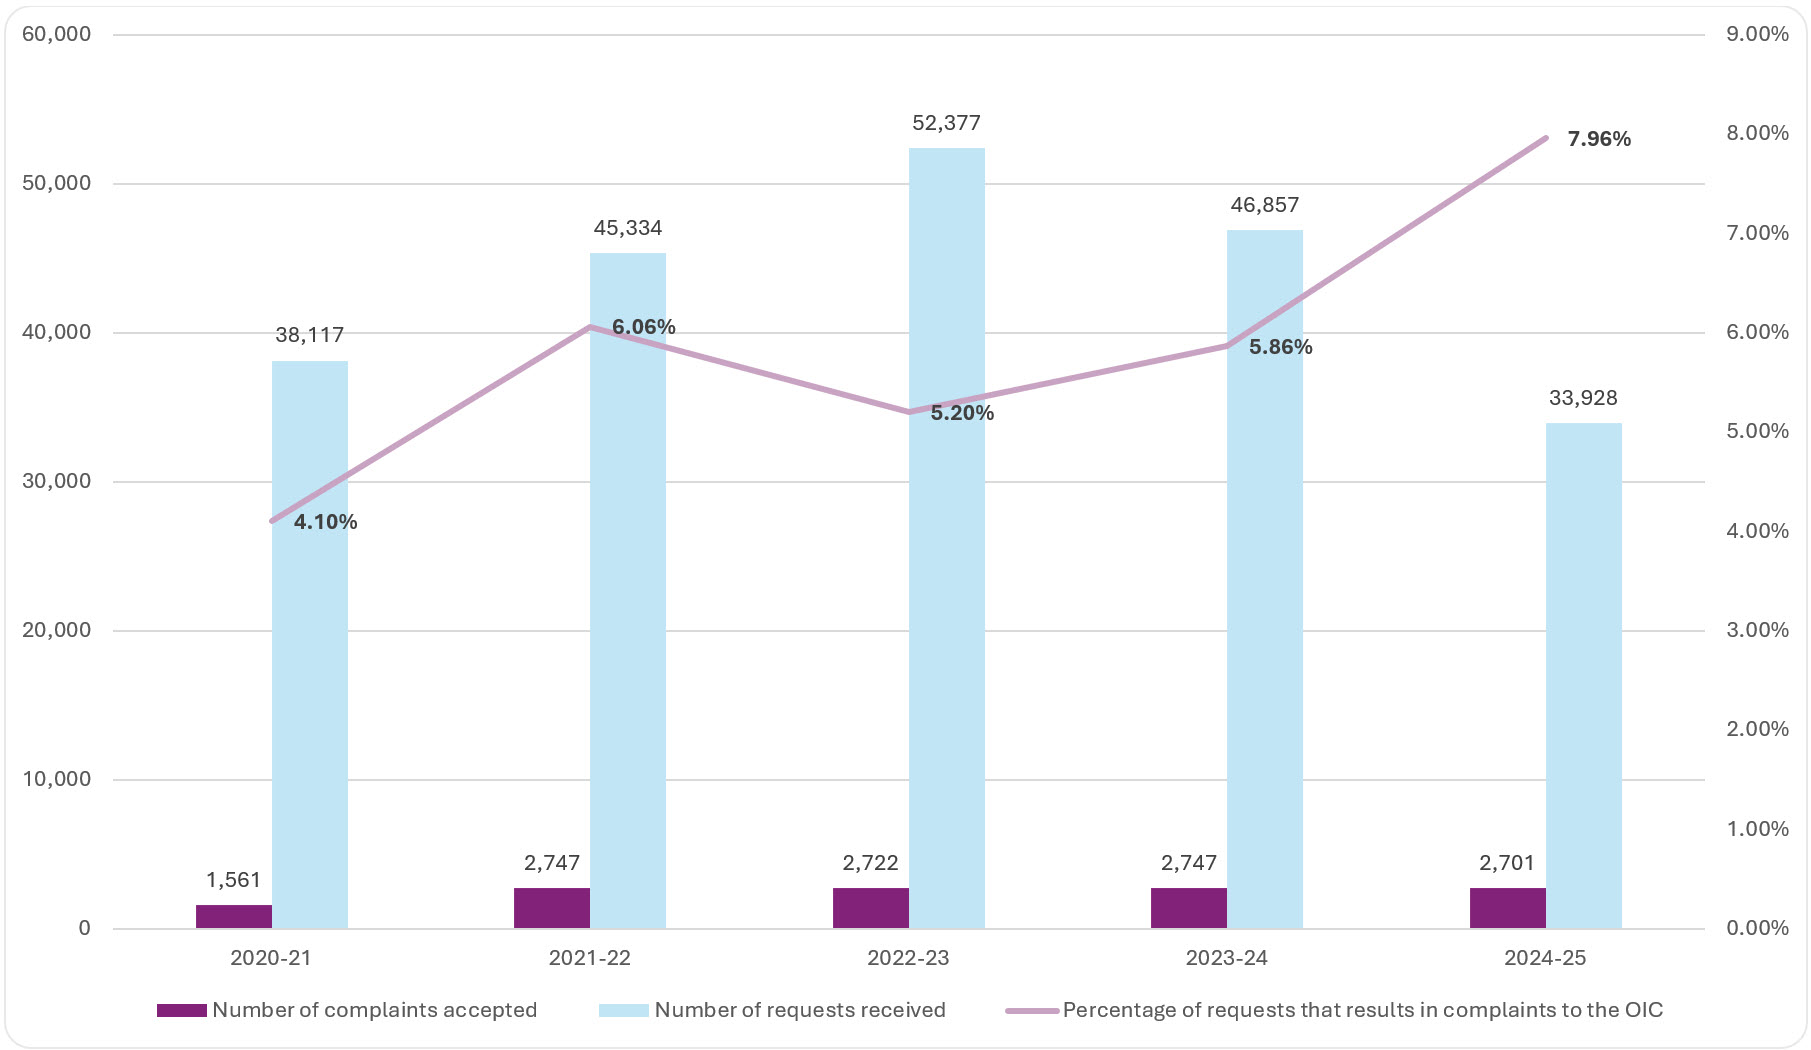
When including IRCC, complaints represented 1.79% of all access to information requests, marking a 0.33% increase from the previous year. Excluding IRCC, the proportion rose to 7.96%, up from 5.86% in 2023-24.
Figure 21: Access to information requests received compared to complaints accepted (including IRCC), 2020-21 to 2024-25
Text version
| Access to information requests received compared to complaints (including IRCC), 2020-21 to 2024-25 | Number of complaints accepted | Number of requests received | Percentage of requests that results in complaints to the OIC |
|---|---|---|---|
2020-21 | 4,068 | 145,962 | 2.79% |
2021-22 | 6,945 | 222,807 | 3.12% |
2022-23 | 7,407 | 236,964 | 3.13% |
2023-24 | 3,361 | 229,564 | 1.46% |
2024-25 | 3,626 | 202,915 | 1.79% |
Figure 22: Access to information requests received compared to complaints accepted (excluding IRCC), 2020-21 to 2024-25
Text version
| Access to information requests received compared to complaints (excluding IRCC), 2020-21 to 2024-25 | Number of complaints accepted | Number of requests received | Percentage of requests that results in complaints to the OIC |
|---|---|---|---|
2020-21 | 1,561 | 38,117 | 4.10% |
2021-22 | 2,747 | 45,334 | 6.06% |
2022-23 | 2,722 | 52,377 | 5.20% |
2023-24 | 2,747 | 46,857 | 5.86% |
2024-25 | 2,701 | 33,928 | 7.96% |