Observations on the state of the access to information system (2023-2024)
Executive Summary
This report analyzes statistical information related to the administration of the Access to Information Act (the Act) submitted by 195 federal institutions to the Treasury Board of Canada Secretariat (TBS) for the fiscal year 2023–2024. It is based on the Access to Information and Privacy Statistical Report for 2023–2024 published on December 20, 2024 on the TBS website.
Key observations include:
Minimal improvement in access to information system performance:
- Statistical reports for 2023–2024 indicate few positive changes in the access system.
- Immigration, Refugees and Citizenship Canada (IRCC) stands out for its relatively high rate of responses within legislated timelines compared to the previous reporting period.
- The 2023–2024 period marks the first time since 2018–2019 that more requests were closed than received.
Challenges with timeliness persist:
- About a quarter of all access requests are not responded to within legislated timelines
- When excluding IRCC, the number of requests closed within 30 days declines by 12% compared to 2022–2023.
Record-high volume of requests:
- The total number of access requests in the system reaches its highest level since the start of the Commissioner’s mandate.
- While fewer requests were received in 2023–2024, the overall volume (including carried-over requests) continues to grow.
Business sector drives high request volumes:
- A large proportion of requests come from businesses, particularly those made to IRCC.
Rising administrative costs:
- The cost of administering the access system has continued to increase.
Access to information requests received
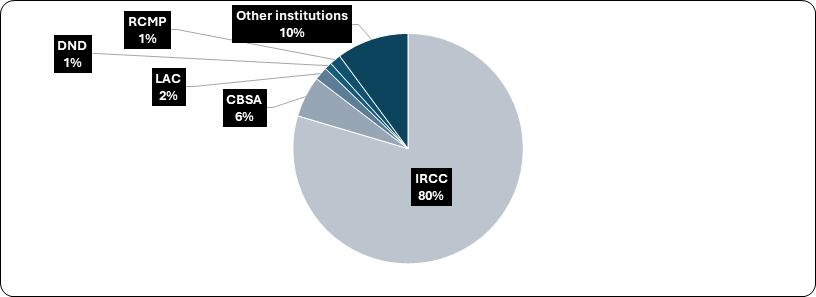
In 2023–2024, a total of 229,764 access to information requests were received government-wide under the Act, representing a 3% decrease from the previous year. IRCC remains the dominant recipient of these requests.
- IRCC accounted for 79.6% of all requests.
- Canada Border Services Agency (CBSA) received 5.79% of requests.
- The Royal Canadian Mounted Police (RCMP), Library and Archives Canada (LAC), and the Department of National Defence (DND) collectively accounted for 4.49% of requests.
- All remaining institutions received 10.12% of total requests.
In addition, 30,816 informal requests were received across government.
Of all institutions, 67.7% receive less than 30 requests, and 52.3% receive fewer than 10 requests.
Figure 1: Distribution of access to information requests received by institution, 2023–2024
*Rounded to the nearest whole number.
Text version
Figure 1
Pie chart showing the distribution of access to information requests received by institution; refer to the data table on this page for details.
| Institutions | Percentage |
|---|---|
| IRCC | 80% |
| CBSA | 6% |
| LAC | 2% |
| DND | 1% |
| RCMP | 1% |
| Other institutions | 10% |
Source of access to information requests
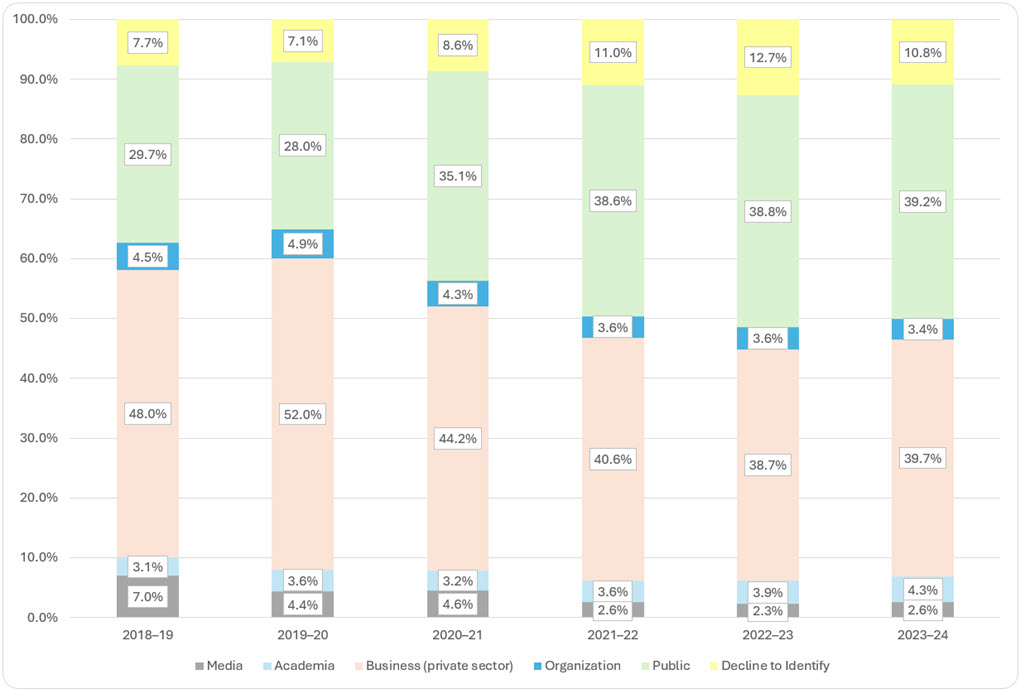
Businesses and the public accounted for 80% of all access to information requests received. Academia, organizations and the media made up the remainder. About 10% of requesters declined to identify themselves.
IRCC plays a major role in shaping this overall trend, as it receives a high volume of requests from professionals and individuals seeking information on immigration status. In 2023–2024, requests from the business sector and the public accounted for 66% of all access requests received by IRCC.
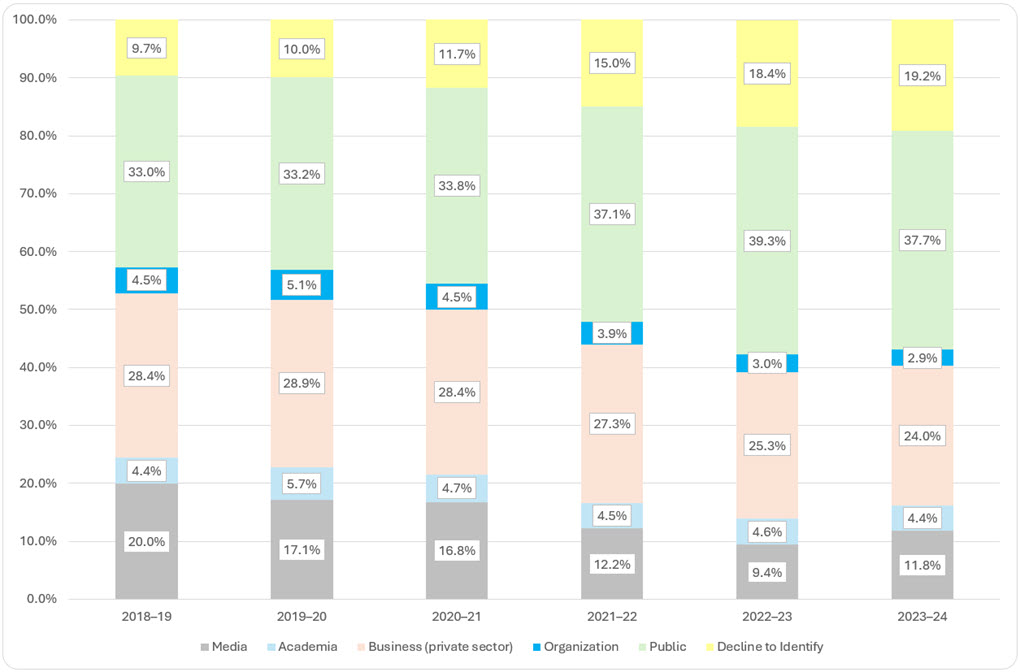
A steady decline in requests from the media has been observed, decreasing from almost 7% at the start of the Commissioner’s first mandate to around 2.5% in 2023–2024. When excluding IRCC, we observe a decrease from 20% in 2018–2019 to almost 12% in 2023–2024.
As journalists have expressed frustration with the current access system, some may choose not to identify as media. In that context, it is worth noting that the proportion of requesters declining to identify has been stable for the last three years at around 11%. However, a slight increase from 8% was observed from 2020–2021 to 2021–2022.
Figure 2: Source of access requests (all institutions including IRCC), 2018-2019 to 2023–2024
Text version
Figure 2
Chart showing source of access requests (all institutions including IRCC), 2018-2019 to 2023–2024; refer to the data table on this page for details.
| 2018–19 | 2019–20 | 2020–21 | 2021–22 | 2022–23 | 2023–24 | |
|---|---|---|---|---|---|---|
| Media | 7.0% | 4.4% | 4.6% | 2.6% | 2.3% | 2.6% |
| Academia | 3.1% | 3.6% | 3.2% | 3.6% | 3.9% | 4.3% |
| Business (private sector) | 48.0% | 52.0% | 44.2% | 40.6% | 38.7% | 39.7% |
| Organization | 4.5% | 4.9% | 4.3% | 3.6% | 3.6% | 3.4% |
| Public | 29.7% | 28.0% | 35.1% | 38.6% | 38.8% | 39.2% |
| Decline to Identify | 7.7% | 7.1% | 8.6% | 11.0% | 12.7% | 10.8% |
Figure 3: Source of access requests (excluding IRCC), 2018-2019 to 2023–2024
Text version
Figure 3
Chart showing source of access requests (excluding IRCC), 2018-2019 to 2023–2024; refer to the data table on this page for details.
| 2018–19 | 2019–20 | 2020–21 | 2021–22 | 2022–23 | 2023–24 | |
|---|---|---|---|---|---|---|
| Media | 20.0% | 17.1% | 16.8% | 12.2% | 9.5% | 11.8% |
| Academia | 4.4% | 5.7% | 4.7% | 4.5% | 4.6% | 4.4% |
| Business (private sector) | 28.4% | 28.9% | 28.4% | 27.3% | 25.3% | 24.0% |
| Organization | 4.5% | 5.1% | 4.5% | 3.8% | 3.0% | 2.9% |
| Public | 33.0% | 33.2% | 33.8% | 37.1% | 39.3% | 37.7% |
| Decline to Identify | 9.7% | 10.0% | 11.7% | 15.0% | 18.4% | 19.2% |
| Total | 41034 | 39294 | 38117 | 45334 | 52377 | 46857 |
Requests closed
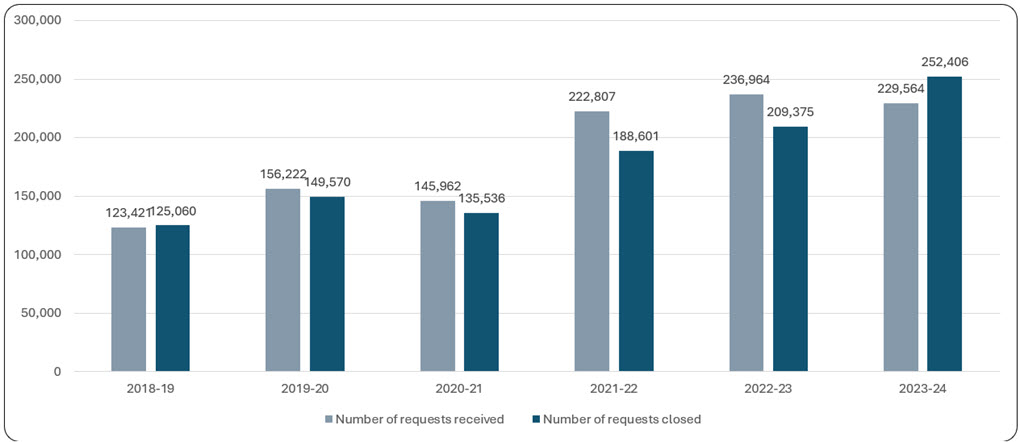
The 2023–2024 period marks the first time since 2018-2019 that more requests were closed than received.
Including IRCC, 9.95% more requests were closed than received by institutions. When IRCC is excluded, this figure drops to 1.72%.
Figure 4: Access to information requests received and closed by all institutions, 2018–2019 to 2023–2024
Text version
Figure 4
Chart showing the number of access to information requests received and closed by all institutions, 2018-2019 to 2023–2024; refer to the data table on this page for details.
| Number of requests received | Number of requests closed | |
|---|---|---|
| 2018-19 | 123,421 | 125,060 |
| 2019-20 | 156,222 | 149,570 |
| 2020-21 | 145,962 | 135,536 |
| 2021-22 | 222,807 | 188,601 |
| 2022-23 | 236,964 | 209,375 |
| 2023-24 | 229,564 | 252,406 |
Figure 5: Access to information requests received and closed by institutions (excluding IRCC), 2018–2019 to 2023–2024
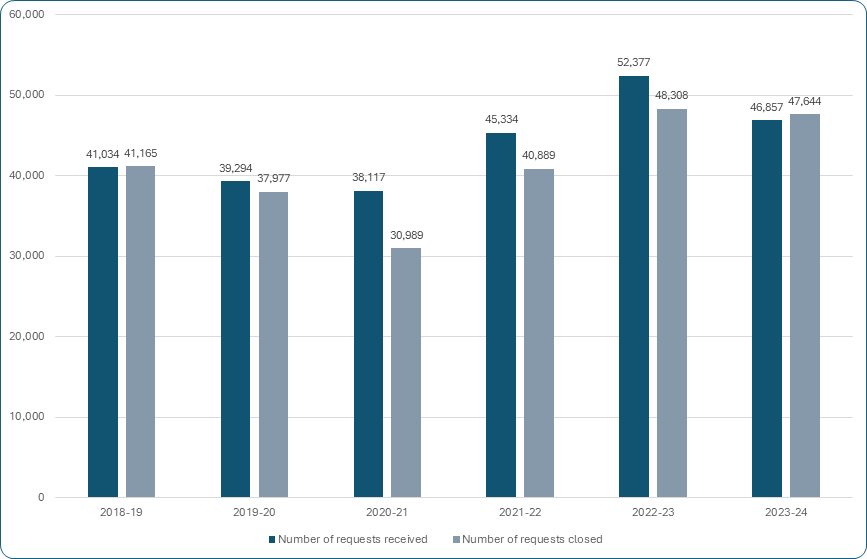
Text version
Figure 5
Chart showing the number of access to information requests received and closed by all institutions (excluding IRCC), 2018-2019 to 2023–2024; refer to the data table on this page for details.
| Number of requests received | Number of requests closed | |
|---|---|---|
| 2018-19 | 41,034 | 41,165 |
| 2019-20 | 39,294 | 37,977 |
| 2020-21 | 38,117 | 30,989 |
| 2021-22 | 45,334 | 40,889 |
| 2022-23 | 52,377 | 48,308 |
| 2023-24 | 46,857 | 47,644 |
Privacy requests received
We are seeing a steady increase in privacy requests, increasing the workload of ATIP units. Notably, from 2022–2023 to 2023–2024, we observe an increase of 188.5% to IRCC and 82.3% to CBSA.
In July 2022, Privacy Act Extension Order, No. 3, came into force, extending the right to be given access to personal information under subsection 12(1) of the Privacy Act to all individuals outside Canada. This change may account for the sharp jump in the number of privacy requests since 2021–2022.
In 2023–2024, IRCC received 41,565 privacy requests from foreign nationals outside of Canada, a significant increase from 6,425 requests in 2022–2023. CBSA received 7,184 privacy requests from foreign nationals outside of Canada, up from 728 requests the year before.
Figure 6: Privacy requests received, 2018-2019 to 2023-2024
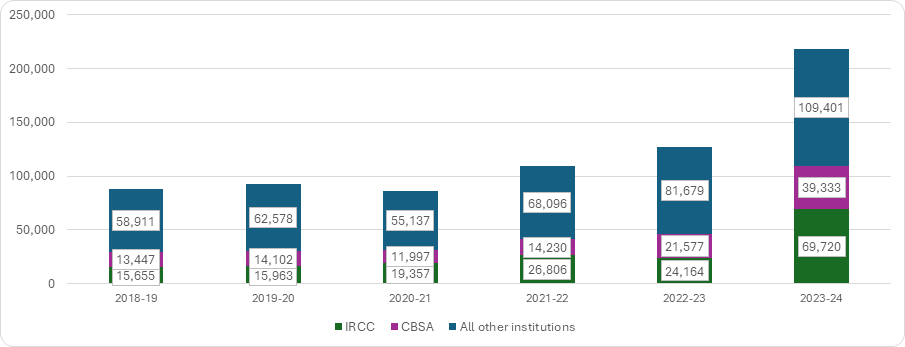
Text version
Figure 6
Chart showing number of privacy requests received by IRCC, CBSA, and all other institutions, 2018-2019 to 2023–2024; refer to the data table on this page for details.
| 2018-19 | 2019-20 | 2020-21 | 2021-22 | 2022-23 | 2023-24 | |
|---|---|---|---|---|---|---|
| IRCC | 15655 | 15963 | 19357 | 26806 | 24164 | 69720 |
| CBSA | 13447 | 14102 | 11997 | 14230 | 21577 | 39333 |
| All other institutions | 58911 | 62578 | 55137 | 68096 | 81679 | 109401 |
Requests carried over
An increasing number of requests were carried over from previous reporting periods at the start of 2023–2024. Across all institutions, including IRCC, 30.1% of access requests were carried over ─ the highest proportion since the start of the Commissioner’s first mandate.
Figure 7: Access to information requests received during reporting period and outstanding from previous reporting periods, 2018–2019 to 2023–2024
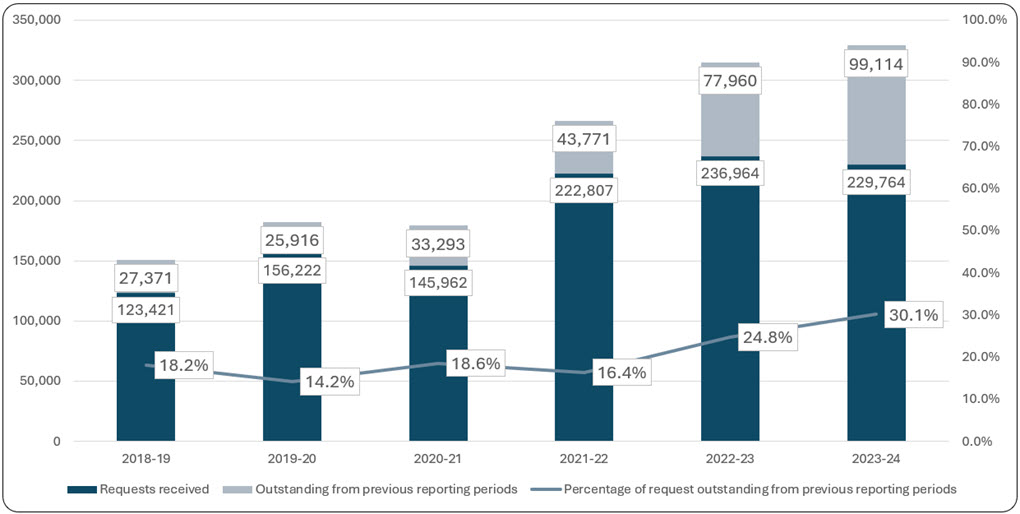
Text version
Figure 7
Chart showing number of access to information requests received during reporting period and outstanding from previous reporting periods, 2018-2019 to 2023–2024; refer to the data table on this page for details.
| 2018-19 | 2019-20 | 2020-21 | 2021-22 | 2022-23 | 2023-24 | |
|---|---|---|---|---|---|---|
| Requests received | 27371 | 25916 | 33293 | 43771 | 77960 | 99114 |
| Outstanding from previous reporting periods | 123421 | 156222 | 145962 | 222807 | 236964 | 229764 |
| Percentage of requests outstanding from previous reporting periods | 18.2% | 14.2% | 18.6% | 16.4% | 24.8% | 30.1% |
Longstanding backlogs
At the start of 2023–2024, 19% of all access to information requests had been carried over for two fiscal years or more. Some institutions had particularly high proportions of older requests, with nearly 90% of DND’s backlog exceeding two years.
Other institutions with a large volume of requests carried over for two years or more included:
- Communications Security Establishment (81%)
- Environment and Climate Change Canada (ECCC) (74%)
- Public Health Agency of Canada (77%)
Growth of backlogs
About 7% of institutions carried over more requests to 2024–2025 than they closed in 2023–2024. These include:
- Correctional Service Canada
- Department of Justice
- Global Affairs Canada (GAC)
- Innovation, Science and Economic Development Canada
- Health Canada
- ECCC.
Nearly 10% of all institutions finished 2023–2024 with at least 50% more access requests than they had at the beginning of the year. Some of the most significant backlog growth was observed at the following institutions:
- Canadian Human Rights Commission (+350%)
- Canada Energy Regulator (+209%)
- National Capital Commission (+82.3 %)
- Privy Council Office (+65.9 %)
- GAC (+55.2%).
Reduction in carried-over requests to 2024–2025
By the end of 2023–2024, the total number of carried-over requests decreased by 21.7%.
Request completion time
IRCC’s high rate of closing requests within 30 days and responding within legislated timelines in 2023–2024 significantly impacts overall compliance rates. That said, about a quarter of all access requests are not responded to within legislated timelines.
When excluding IRCC, we see that:
- less than half of access to information requests (46.8%) are responded to within 30 days, a decrease of almost 14% compared to 2022–2023
- nearly 30% of access requests (73.4%) are not responded to within legislated timelines, though this represents a 4.9% improvement from the previous year.
Figure 8: Percentage of access to information requests closed within 30 days (including IRCC), 2018–2019 to 2023–2024
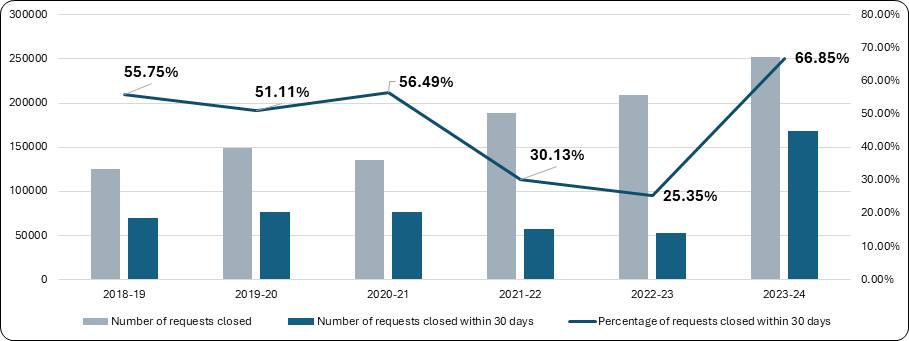
Text version
Figure 8
Chart showing percentage of access to information requests closed within 30 days (including IRCC), 2018-2019 to 2023–2024; refer to the data table on this page for details.
| Number of requests closed | Number of requests closed within 30 days | Percentage of requests closed within 30 days | |
|---|---|---|---|
| 2018-19 | 125060 | 69729 | 55.75% |
| 2019-20 | 149570 | 76455 | 51.11% |
| 2020-21 | 135536 | 76568 | 56.49% |
| 2021-22 | 188601 | 56844 | 30.13% |
| 2022-23 | 209375 | 53079 | 25.35% |
| 2023-24 | 252406 | 168729 | 66.85% |
Figure 9: Percentage of access to information requests closed within 30 days (excluding IRCC), 2018–2019 to 2023–2024
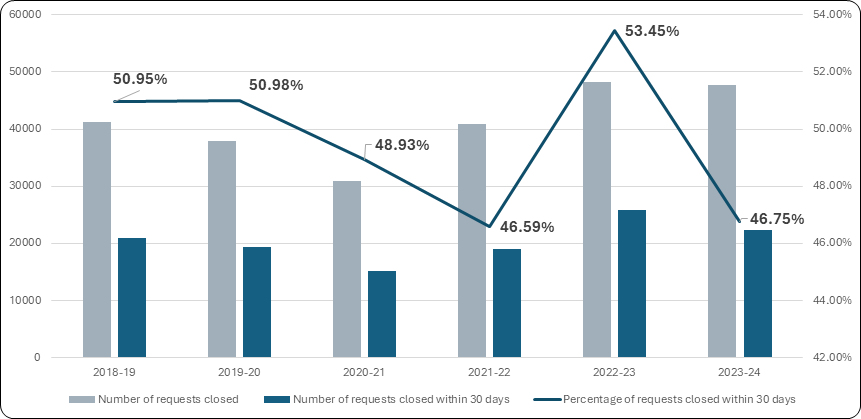
Text version
Figure 9
Chart showing percentage of access to information requests closed within 30 days (excluding IRCC), 2018-2019 to 2023–2024; refer to the data table on this page for details.
| Number of requests closed | Number of requests closed within 30 days | Percentage of requests closed within 30 days | |
|---|---|---|---|
| 2018-19 | 41165 | 20975 | 50.95% |
| 2019-20 | 37977 | 19363 | 50.98% |
| 2020-21 | 30989 | 15163 | 48.93% |
| 2021-22 | 40889 | 19051 | 46.59% |
| 2022-23 | 48308 | 25822 | 53.45% |
| 2023-24 | 47644 | 22272 | 46.75% |
Figure 10: Percentage of access to information requests closed within legislated timelines (including IRCC), 2018–2019 to 2023–2024
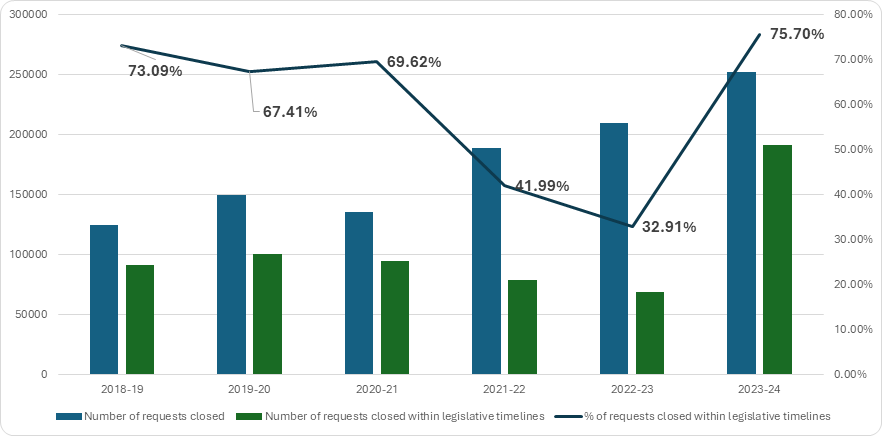
Text version
Figure 10
Chart showing number of and percentage of access to information requests closed within legislated timelines (including IRCC), 2018-2019 to 2023–2024; refer to the data table on this page for details.
| Number of requests closed | Number of requests closed within legislative timelines | % of requests closed within legislative timelines | |
|---|---|---|---|
| 2018-19 | 125060 | 91402 | 73.09% |
| 2019-20 | 149570 | 100827 | 67.41% |
| 2020-21 | 135536 | 94359 | 69.62% |
| 2021-22 | 188601 | 79189 | 41.99% |
| 2022-23 | 209375 | 68904 | 32.91% |
| 2023-24 | 252406 | 191061 | 75.70% |
Figure 11: Percentage of access to information requests closed within legislated timelines (excluding IRCC), 2018–2019 to 2023–2024
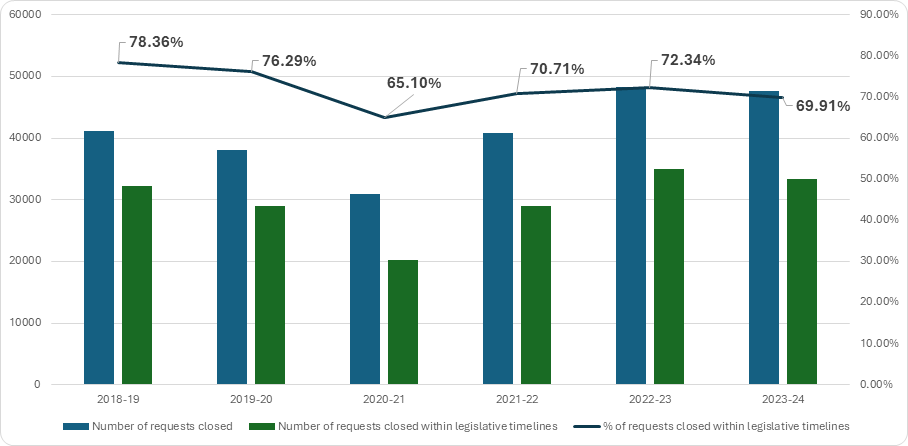
Text version
Figure 11
Chart showing percentage of access to information requests closed within legislated timelines (excluding IRCC), 2018-2019 to 2023–2024; refer to the data table on this page for details.
| Number of requests closed | Number of requests closed within legislatives timelines | % of requests closed within legislative timelines | |
|---|---|---|---|
| 2018-2019 | 41165 | 32256 | 78.36% |
| 2019-2020 | 37977 | 28971 | 76.29% |
| 2020-2021 | 30989 | 20175 | 65.10% |
| 2021-2022 | 40889 | 28913 | 70.71% |
| 2022-2023 | 48308 | 34947 | 72.34% |
| 2023-2024 | 47644 | 33309 | 69.91% |
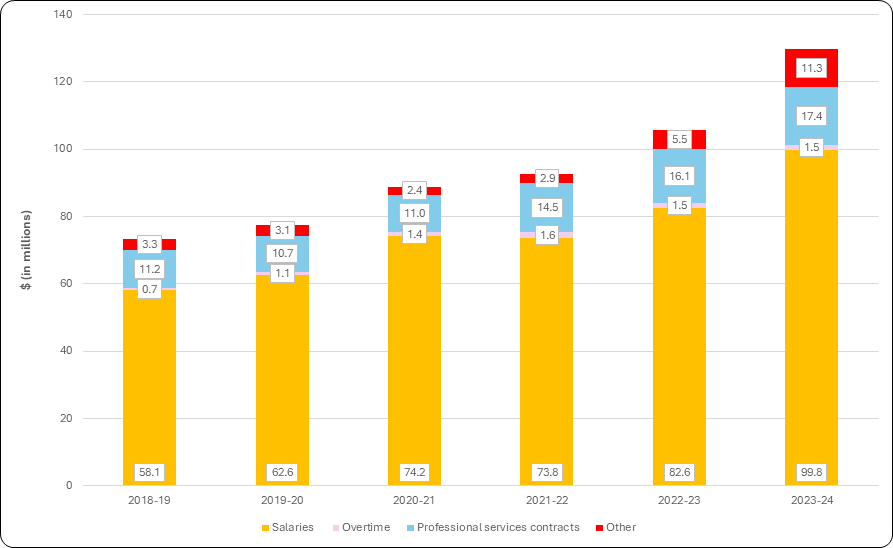
Program Expenditure
While costs of administering the Act have steadily risen, the volume of requests closed during the reporting period has also risen. The average cost per access request processed in 2023–2024 was $514.40. On average, between 2018–2019 and 2023–2024, each processed request cost $546.10.
Figure 12: Spending on Access to Information program across government, 2018–2019 to 2023–2024
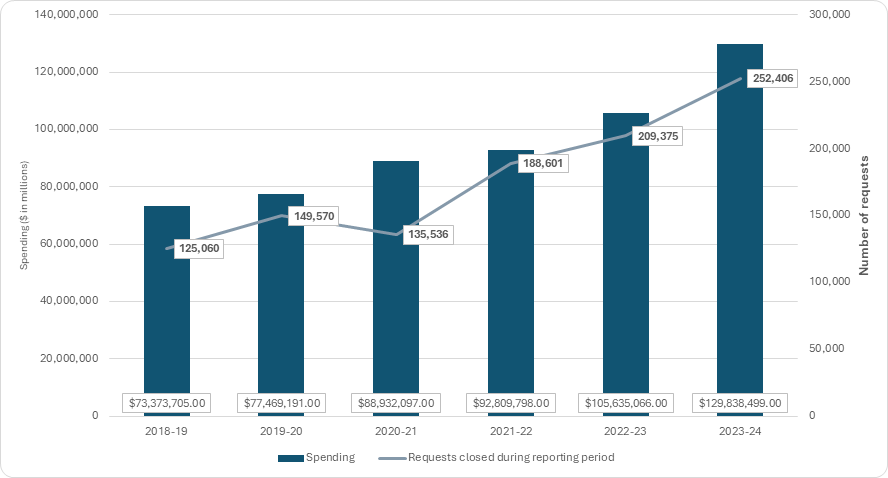
Text version
Figure 12
Chart showing requests closed and spending on Access to Information program across government, 2018-2019 to 2023–2024; refer to the data table on this page for details.
| Requests closed during reporting period | Spending | |
|---|---|---|
| 2018-19 | 125060 | 73373705 |
| 2019-20 | 149570 | 77469191 |
| 2020-21 | 135536 | 88932097 |
| 2021-22 | 188601 | 92809798 |
| 2022-23 | 209375 | 105635066 |
| 2023-24 | 252406 | 129838499 |
Cost drivers
Largest expenditures are consistently salaries, followed by Goods and Services and Professional services contracts which increased by 55% from 2018–2019 to 2023–2024.
- In 2023–2024, the Program and Administrative Services (PA) group signed a new collective agreement, effective June 2023, accounting for some of the increase in the labour costs.
- The PA group received 3% economic increase and a 0.5% pay line adjustment, for a compounded total increase of 10.104% of June 21, 2020, rates.
- This increase in labour costs has contributed to the rise in program costs.
- We also observe a 7% increase in the number of employees working in ATIP units from 2022–2023 to 2023–2024.
2023–2024 also saw the introduction of ATIP Express across many institutions, likely accounting for the 32% increase in Goods and Services from 2022–2023.
Figure 13: Spending on Access to Information program by category across government, 2018–2019 to 2023–2024 (in millions)
Text version
Figure 13
Chart showing spending on Access to Information program by category across government, 2018-2019 to 2023–2024; refer to the data table on this page for details.
| Salaries | Overtime | Professional services contracts | Other | |
|---|---|---|---|---|
| 2018-19 | 58123125 | 702801 | 11204834 | 3342945 |
| 2019-20 | 62594988 | 1057554 | 10719300 | 3097349 |
| 2020-21 | 74197111 | 1351880 | 11028477 | 2354629 |
| 2021-22 | 73758288 | 1643990 | 14459470 | 2948050 |
| 2022-23 | 82553123 | 1469348 | 16116613 | 5495982 |
| 2023-24 | 99766907 | 1450435 | 17352163 | 11268994 |
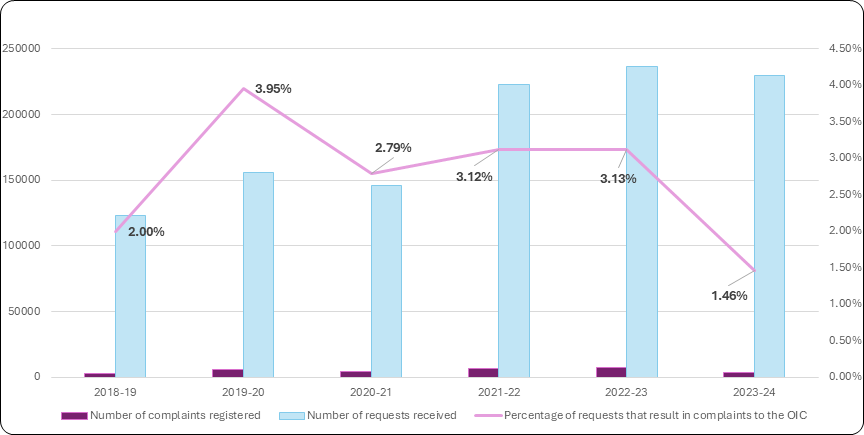
Requests vs Complaints
In 2023–2024, the volume of complaints received was the lowest since the initial impact of the COVID-19 pandemic.
When including IRCC, complaints represented 1.46% of all access to information requests—the lowest proportion since the start of the Commissioner’s mandate. However, excluding IRCC, the proportion rose to 5.86%, marking an increase from 2022–2023 and the second highest since the mandate began.
Figure 14: Access to information requests received across government compared to complaints, 2018–2019 to 2023–2024
Text version
Figure 14
Chart showing access to information requests received across government compared to complaints, 2018-2019 to 2023–2024; refer to the data table on this page for details.
| Number of complaints registered | Number of requests received | Percentage of requests that result in complaints to the OIC | |
|---|---|---|---|
| 2018-19 | 2467 | 123421 | 2.00% |
| 2019-20 | 6173 | 156222 | 3.95% |
| 2020-21 | 4068 | 145,962 | 2.79% |
| 2021-22 | 6945 | 222,807 | 3.12% |
| 2022-23 | 7407 | 236,964 | 3.13% |
| 2023-24 | 3361 | 229,764 | 1.46% |
Figure 15: Access to information requests received compared to complaints (excluding IRCC), 2018–2019 to 2023–2024
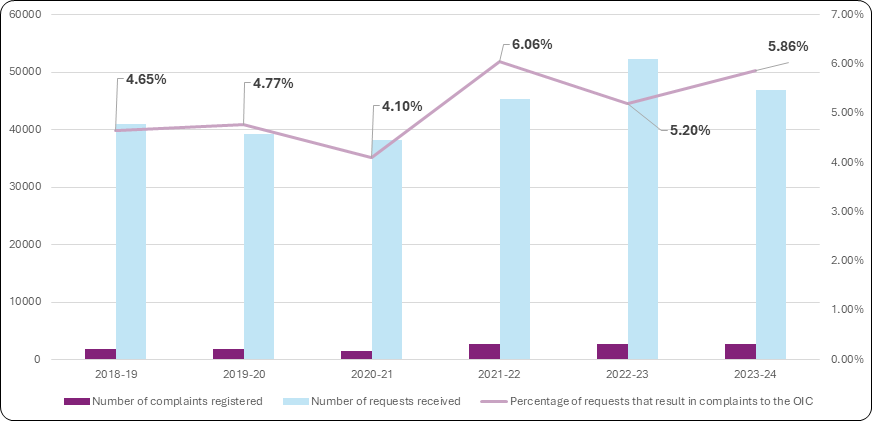
Text version
Figure 15
Chart showing access to information requests received compared to complaints (excluding IRCC), 2018-2019 to 2023–2024; refer to the data table on this page for details.
| Number of complaints registered | Number of requests received | Percentage of requests that result in complaints to the OIC | |
|---|---|---|---|
| 2018-19 | 1910 | 41034 | 4.65% |
| 2019-20 | 1875 | 39294 | 4.77% |
| 2020-21 | 1561 | 38,117 | 4.10% |
| 2021-22 | 2747 | 45,334 | 6.06% |
| 2022-23 | 2722 | 52,377 | 5.20% |
| 2023-24 | 2747 | 46,857 | 5.86% |