2013-2014 Natural Resources Canada
Natural Resources Canada's (NRCan) mandate is the sustainable development and use of natural resources: energy, minerals and metals, earth sciences and forestry. It develops policies and programs that enhance the contribution of the natural resources sector to the economy.
A total of 689 requests were received by NRCan in 2013–2014, representing a decrease of 10.4% compared to the last reporting period. This follows a significant increase in 2012–2013, as requests received went up by 114.8% compared to 2011–2012. NRCan also received 27.9% less consultation requests from other government institutions.
Despite the decrease in requests (new and consultations) received and in the number of pages to process, NRCan’s performance was generally below results achieved in 2012–2013, as well as below the proportions government-wide in 2013–2014.
In 2013–2014, NRCan completed 685 requests, or 77.9% of all it requests in inventory. This is similar to the last reporting period, when 78.3% of requests were completed.
Most of the requests received in 2013–2014 came from the media (47.2%), followed by organizations (28.7%) and members of the public (12.8%).
Table 1. Workload
| Measures | Reporting Period 2012–2013 |
Reporting Period 2013–2014 |
Difference |
|---|---|---|---|
| Number of requests received | 769 | 689 | -10.40% |
| Number of consultations received (from other government institutions) | 269 | 194 | -27.88% |
| Average number of pages processed per request completed | 160 | 109 | -51 |
| % of requests for which more than 1,000 pages were processed | 3.90% | 2.18% | -1.72% |
| Note: The average number of pages processed per request completed and the percentage of requests for which more than 1,000 pages were processed are calculated from the total of requests completed for which the information was disclosed (in part or totally), exempted/excluded and for requests abandoned. It excludes requests completed for the following dispositions: no records exist, requests transferred and requests treated informally. | |||
The volume of pages processed proportionally decreased by one-third, as the average of pages per request completed went down from 160 in 2012–2013 to 109.
Timeliness
NRCan responded to 341 requests within 30 days or less, which represents about 49.8% of the completed requests in 2013–2014 (a significant decrease from the previous year; 60.26%). The proportion of requests completed in more than 120 days increased by 1.79%, achieving about 16.9% in 2013–2014. The average number of days to complete a request in 2013–2014 was 77 days (compared to 61 days the year before).Footnote 1
From the 685 completed requests, 14 (or 2%) were closed past the statutory deadline in 2013-14. This proportion represents an “A”Footnote 2 grade. This is similar to 2012–2013. External consultation was the principal reason given for why requests were closed late in 2013–2014 (6 out of the 14 requests).
Extensions
In 2013–2014, a total of 356 extensions were required to complete the 689 requests. This represents a rate of about 0.52 extensions per request competed. This above the rate in 2012–2013 (0.44), showing a significant increase in the use of extensions. This may have contributed to NRCan’s low deemed refusal rate.
About 12.4% of these extensions were for 30 days or less, compared to 8% in 2012-13. However, the proportion of longer extensions (121 days or more) increased significantly from 18.7% in 2012–2013 to 35.7% in 2013–2014.
Figure 1. Length of extensions (2011–2012 to 2013–2014)
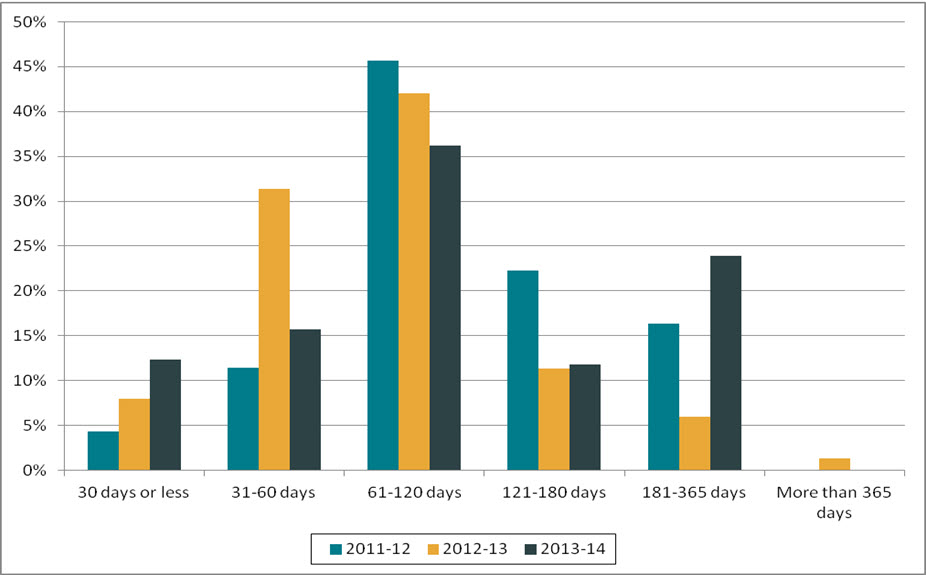
Text version
Figure 1 is a bar chart with vertical bars, representing the length of extensions taken by NRCan during each reporting period between 2011–2012 and 2013–2014. The results are as follows:
| Reporting period | 30 days or less | 31-60 days | 61-120 days | 121-180 days | 181-365 days | More than 365 days |
|---|---|---|---|---|---|---|
| 2011–2012 | 4.35% | 11.41% | 45.65% | 22.28% | 16.30% | 0.00% |
| 2012–2013 | 8.00% | 31.33% | 42.00% | 11.33% | 6.00% | 1.33% |
| 2013–2014 | 12.36% | 15.73% | 36.24% | 11.80% | 23.88% | 0.00% |
A majority of the extensions (70.5%) were taken for consultations under section 9(1)(b). This proportion was similar in 2012–2013.
Disclosure
From the 685 requests completed in 2013–2014, 20.9% of them were disclosed entirely, a decrease compared to the reporting year 2012–2013. About 18.8% of requests yielded no records, which is higher than the government-wide level (10.5%). More than half of the pages processed (64.6%) were also disclosed in 2013–2014 (an improvement from 2012–2013; 52.82%).
Exemptions/Exclusions
The proportion of requests completed for which the information was all excluded was 5% in 2013–2014. In comparison, this proportion was 0.9% government-wide for the same period. Exclusions applied under 69(1)g) went up by 163% (from 46 exclusions in 2012–2013 to 121 in 2013–2014).
A total of 904 exemptions and 231 exclusions were applied in 2013–2014, a ratio of 1.66 exemptions/exclusions per request completed (an improvement from the previous year; 1.98).
Table 2. Performance
| Measures | Reporting Period 2012–2013 |
Reporting Period 2013–2014 |
Difference | |
|---|---|---|---|---|
| Completion of Requests | ||||
| Completion rate | 78.34% | 77.93% | -0.41% | |
| Completion Time | ||||
| % of requests completed within 30 days | 60.26% | 49.78% | -10.48% | |
| Average number of days to complete a request | 61 | 77 | 16 | |
| % of requests closed past statutory or extended deadline | 3.49% | 2.04% | -1.45% | |
| % of consultations from government institution completed within 30 days | 63.76% | 87.89% | 24.13% | |
| % of extensions of 30 days or less | 8.00% | 12.36% | 4.36% | |
| Level of Disclosure | ||||
| % of pages processed that were disclosed | 52.82% | 64.63% | 11.81% | |
| % of requests completed for which the information was disclosed entirely | 26.93% | 20.88% | -6.05% | |
| % of pages disclosed entirely | 11.76% | 15.41% | 3.65% | |
| Exemptions/Exclusions | ||||
| Number of exemptions/exclusions per request completed | 1.98 | 1.66 | -0.32 | |
Other activities
According to NRCan’s annual report, a number of activities were undertaken during 2013–2014 in order to improve the administration of the Access to Information Act. For instance, NRCan mentioned that it improved procedures by streamlining its process for extensions and consultations. It is not explained how the changes improved the performance of the institution. It also noted that it provided documents in electronic format whenever appropriate to reduce paper consumption (although, based on the statistical report, 92.5% of all release packages in 2013–2014 were in paper).
Complaints
In 2013–2014, the OIC received 38 complaintsFootnote 3 against NRCan; 19 for refusal and 19 regarding administrative matters. In comparison, 21 complaints were received against this department in 2012–2013: 20 for refusal and 1 administrative complaint.
Most of the complaints received in 2013–2014 were resolved as well founded, while 3 were not well-founded and 3 were discontinued. An additional 15 complaints were still pending as of April 2015.
Footnotes
- Footnote 1
-
Based on response to parliamentary written question Q-485.
- Footnote 2
-
The 2007–2008 OIC report card system was used to estimate a grade: A= 0 to 5%; B= 5 to 10%; C= 10 to 15%; D=15 to 20%, F= more than 20%. The Red Alert grade is reserved for high proportions of requests completed past the statutory deadline.
- Footnote 3
-
The numbers reported in this section are based on the OIC’s statistics. The information may not reflect the statistics reported by institutions due to the discrepancies in the methodology used.