2013-2014 Health Canada
Health Canada (HC) helps Canadians maintain and improve their health by developing health policy, enforcing regulations, promoting disease prevention, and enhancing healthy living for all Canadians.
In 2013–2014, HC received 1,563 requests, representing 2.6% of all requests received government-wide during that reporting period. For the second consecutive year, HC processed fewer pages and received fewer requests and consultations. While HC’s performance in 2013–2014 was similar to 2012–2013, the institution completed fewer requests (67.3% compared to 74.3%) and on average, in more time. Results were still below the government-wide levels.
Most of the 1,563 requests received by HC were from businesses (51.9%) seeking information related to pharmaceuticals, medical devices, and natural health products. There have been important increases in the number of requests received by the public, the media and academia.
In addition, HC received another 395 “informal requests”Footnote 1 that were not captured in its annual Statistical Report. This is 129 fewer than in 2012–2013. However, HC mentioned that this decrease might be due to the fact that requesters sought multiple ATI packages in one request.
Table 1. Workload
| Measures | Reporting Period 2012–2013 | Reporting Period 2013–2014 | Difference |
|---|---|---|---|
| Number of requests received | 1,765 | 1,563 | -11.44% |
| Number of consultations received (from other government institutions) | 186 | 154 | -17.20% |
| Average number of pages processed per request completed | 274 | 167 | -170 |
| % of requests for which more than 1,000 pages were processed | 5.63% | 3.63% | -2.00% |
| Note: The average number of pages processed per request completed and the percentage of requests for which more than 1,000 pages were processed are calculated from the total of requests completed for which the information was disclosed (in part or totally), exempted/excluded and for requests abandoned. It excludes requests completed for the following dispositions: no records exist, requests transferred and requests treated informally. | |||
The workload of pages decreased by 45% in 2013–2014 compared to the previous reporting period. Most requests required the processing of 100 pages or fewer (76.5%), with an average of 167 pages per request. In comparison, requests in 2012–2013 required the processing of an average of 274 pages.
Timeliness
In 2013–2014, HC responded to 701 requests within 30 days or less, which represents about 48.5% of all requests completed. While this proportion is similar to the one achieved in 2012–2013, it is below the government-wide results (61%). The average number of days to complete a request also increased from 99 days in 2012–2013 to 130 days in 2013–2014.Footnote 2
The proportion of requests completed in more than 120 days in 2013–2014 (22.3%) remained high.
The proportion of requests completed past the statutory or extended deadline reached 24.3% in 2013–2014. This represents an “F” grade.Footnote 3 About 79% of these requests had already been extended. Further, in 35% of the cases, they were late by at least 1 year.
Workload was invoked as the principal reason for not meeting the statutory deadline (64.7% of the time).
Extensions
In 2013–2014, 719 extensions were taken by HC, an average of 0.5 extension per request completed. This is higher than in 2012–2013, during which 0.45 extensions per request were taken.
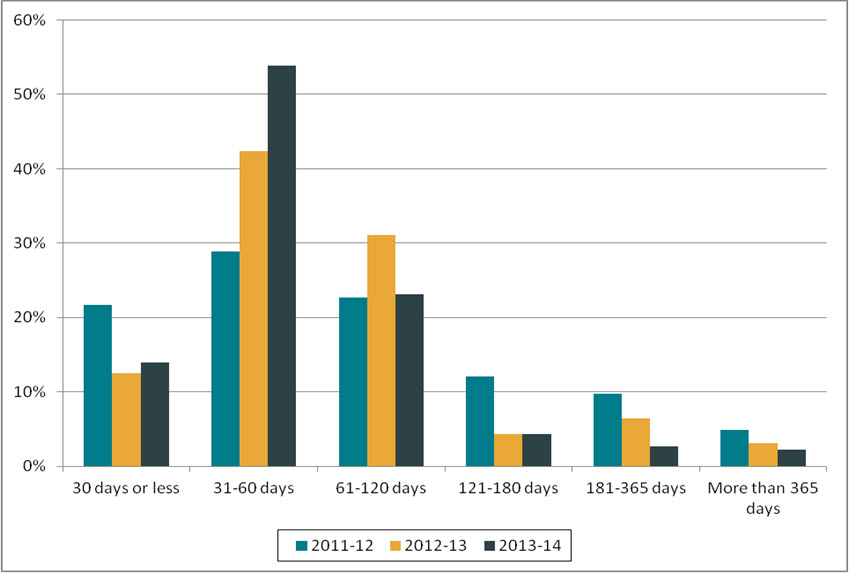
Extensions of 30 days or fewer represented 13.9%. This is similar to the last reporting period (12.5%). Most extensions in 2013–2014 were for 31 to 60 days (53.8%).
Figure 1. Length of extensions (2011–2012 to 2013–2014)
Text version
Figure 1 is a bar chart with vertical bars, representing the length of extensions taken by HC during each reporting period between 2011–2012 and 2013–2014. The results are as follows:
| Reporting period | 30 days or less | 31-60 days | 61-120 days | 121-180 days | 181-365 days | More than 365 days |
|---|---|---|---|---|---|---|
| 2011–2012 | 21.65% | 28.91% | 22.68% | 12.05% | 9.81% | 4.90% |
| 2012–2013 | 12.55% | 42.40% | 31.04% | 4.36% | 6.47% | 3.17% |
| 2013–2014 | 13.91% | 53.82% | 23.09% | 4.31% | 2.64% | 2.23% |
Most extensions in 2013–2014 were taken for consultations under 9(1)(b) (38.4%) or for giving notice to third parties (36.3%). It is the Commissioner’s view that consultations with third parties usually take approximately 60 days.Footnote 4 Although 73.9% of the extensions under 9(1)(c) were for 60 days or less, they were for more than a year in 6.1% of the time.
Disclosure
In 2013–2014, 195 completed requests resulted in the full disclosure of information, representing about 13.5% of all requests completed. In comparison, 26.9% of requests completed government-wide were entirely disclosed.
In 2013–2014, about 16.4% of the completed requests were abandoned. This is also above the government-wide results.
Exemptions/Exclusions
In 2013–2014, a total of 1,730 exemptions and 64 exclusions were applied, an average of 1.24 exemptions/exclusions per request completed. This is proportionally lower than in 2012–2013 (1.32).
Frequently applied exemptions in 2013–2014 included: personal information (721 times), third party information (458 times) and government operations (330 times).
Table 2. Performance
| Measures | Reporting Period 2012–2013 |
Reporting Period 2013–2014 |
Difference | |
|---|---|---|---|---|
| Completion of Requests | ||||
| Completion rate | 74.27% | 67.32% | -6.95% | |
| Completion Time | ||||
| % of requests completed within 30 days | 48.19% | 48.48% | 0.29% | |
| Average number of days to complete a request | 99 | 130 | 31 | |
| % of requests closed past statutory or extended deadline | 26.05% | 24.27% | -1.78% | |
| % of consultations from government institution completed within 30 days | 88.51% | 74.39% | -14.12% | |
| % of extensions of 30 days or less | 12.55% | 13.91% | 1.36% | |
| Level of Disclosure | ||||
| % of pages processed that were disclosed | 64.39% | 72.79% | 8.40% | |
| % of requests completed for which the information was disclosed entirely | 13.56% | 13.49% | -0.07% | |
| % of pages disclosed entirely | 17.61% | 9.01% | -8.60% | |
| Exemptions/Exclusions | ||||
| Number of exemptions/exclusions per request completed | 1.32 | 1.24 | -0.08 | |
Other activities
In 2013–2014, HC completed staffing processes to fill full-time positions, replacing the temporary help consultants and offering better stability to the ATIP office. HC expected to continue its staffing activities during 2014–2015.
2013–2014 was also the first complete year under the new process of shared services between HC and the Public Health Agency of Canada (PHAC), which includes the treatment of ATIP requests. Work to ensure efficiency and to “optimize service delivery” continued.
Complaints
The OIC received a total of 48 complaints against HCFootnote 5 in 2013–2014, compared to 37 complaints in 2012–2013 (decrease of 11 complaints).
Of the 48 complaints registered in 2013–2014, 22 of them were for refusal and 26 were related to administrative matters.
As for the disposition of complaints registered in 2013–2014, 14 were well founded, 14 were not well-founded and 2 were settled. An additional 8 complaints were discontinued while 10 were still pending, as of April 2015.
Footnotes
- Footnote 1
-
These include requests for previously released ATI packages.
- Footnote 2
-
Based on response to parliamentary written question Q-485.
- Footnote 3
-
The 2007–2008 OIC report card grading system was used to estimate the grade: A=0 to 5%, B=5 to 10%, C=10 to 15%, D=15 to 20%, F=more than 20%.
- Footnote 4
-
See the OIC's advisory notice on extensions.
- Footnote 5
-
The numbers reported in this section are based on the OIC’s statistics. The information may not reflect the statistics reported by institutions due to the discrepancies in the methodology used.