2013-2014 Canada Post Corporation
Canada Post Corporation (CPC) operates Canada’s postal delivery service, running more than 6,600 post offices across the country and processing 45 million pieces of mail per business day. CPC was one of the 70 institutions that became subject to the Access to Information Act in 2006 and 2007 under the Federal Accountability Act.
In 2013–2014, CPC received 109 requests, an increase of 4 requests (3.8%) compared to 2012–2013 (105 requests). CPC showed signs of improvement in 2013–2014 compared to the previous year, especially in terms of timeliness where it performed above the government-wide levels.
CPC completed 87.3% of all requests in its inventory in 2013–2014, which is similar to the previous year’s completion rate (88.8%).
Requests received in 2013–2014 came principally from three categories of requesters: members of the public (46.8%), the media (29.4%) and the private sector (22%).
CPC also mentioned that it answered to 21 informal requests in 2013-14 (an increase compared to 8 informal requests in 2012–2013).
Table 1. Workload
| Measures | Reporting Period 2012–2013 |
Reporting Period 2013–2014 |
Difference |
|---|---|---|---|
| Number of requests received | 105 | 109 | 3.81% |
| Number of consultations received (from other government institutions) | 44 | 24 | -45.45% |
| Average number of pages processed per request completed | 161 | 217 | 56 |
| % of requests for which more than 1,000 pages were processed | 5.65% | 7.29% | 1.64% |
| Note: The average number of pages processed per request completed and the percentage of requests for which more than 1,000 pages were processed are calculated from the total of requests completed for which the information was disclosed (in part or totally), exempted/excluded and for requests abandoned. It excludes requests completed for the following dispositions: no records exist, requests transferred and requests treated informally. | |||
The volume of pages processed increased significantly in 2013–2014, as an average of 217 pages per completed request closed were processed compared to 161 in 2012–2013. The proportion of completed requests that required processing more than 1,000 pages also increased (from 5.7% to 7.29%).
Timeliness
CPC improved significantly its completion time in 2013–2014 compared to the previous two years.
From a total of 110, 74 requests (67.3%) were completed within 30 days in 2013–2014 (of those, 41.9% yielded no records or were abandoned). This is a significant increase compared to the proportion achieved in 2012–2013 (39.3%). The average time to complete a request in 2013–2014 was 36.8 days. This is also an improvement compared to 2012–2013, when requests were completed in 301 days on average.Footnote 1
Only one request was completed past the statutory or extended deadline.Footnote 2 In comparison, 35 requests were considered late in 2012–2013. The proportion of requests completed past the statutory or extended deadline in 2013–2014 represents an “A” grade.Footnote 3 In fact, from 2011–2012 to 2013–2014, CPC reduced the proportion of requests closed past the statutory or extended deadline by more than 50%.
Extensions
The proportion of extensions applied to requests completed also decreased. In 2013–2014, a total of 18 extensions were used, representing 0.16 extension per request completed compared to 0.4 in 2012–2013. The length of extensions tended to be for 60 days or less (13 extensions, 72% of the time).
Figure 1. Length of extensions (2011–2012 to 2013–2014)
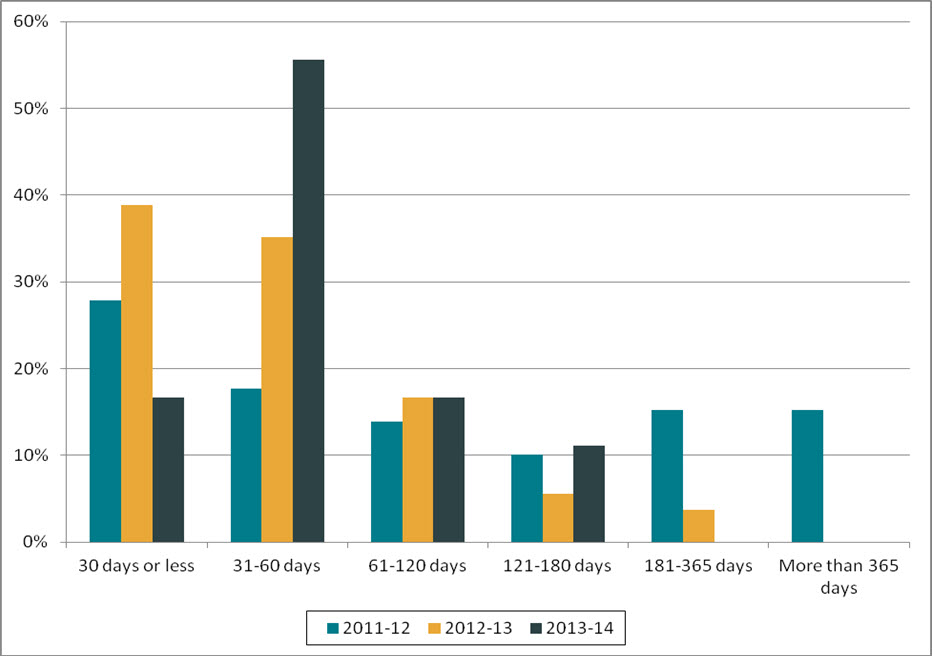
Text version
Figure 1 is a bar chart with vertical bars, representing the length of extensions taken by CPC during each reporting period between 2011–2012 and 2013–2014. The results are as follows:
| Reporting period | 30 days or less | 31-60 days | 61-120 days | 121-180 days | 181-365 days | More than 365 days |
|---|---|---|---|---|---|---|
| 2011–2012 | 27.85% | 17.72% | 13.92% | 10.13% | 15.19% | 15.19% |
| 2012–2013 | 38.89% | 35.19% | 16.67% | 5.56% | 3.70% | 0.00% |
| 2013–2014 | 16.67% | 55.56% | 16.67% | 11.11% | 0.00% | 0.00% |
From the 18 extensions applied in 2013–2014, 9 of them were for third party notice, 7 were taken under 9(1)(a) (interference with operations), and 2 were for consultation under 9(1)(b).
Disclosure
From the completed requests, 20.9% were disclosed entirely, which represents a 2.4% increase compared to 2012–2013. It is however below the government-wide disclosure rate of 26.9% achieved in 2013–2014.
About 42.8% of the pages processed in 2013–2014 were also disclosed, a decrease of 8.7% compared to 2012–2013.However, more pages were disclosed entirely in 2013–2014 (19.2%) than in 2012–2013 (8.9%).
Exemptions/Exclusions
In 2013–2014, a total of 164 exemptions and no exclusions were applied, representing a ratio of 1.49 exemptions per request completed. In comparison, this ratio was 2.02 in 2012–2013.
CPC applied its specific exemption under paragraph 18.1 in 39 requests, compared to 59 requests in 2012–2013. Frequently applied exemptions also included: personal information (33 requests) and government operations under subsection 21(1) (31 requests).
Table 2. Performance
| Measures | Reporting Period 2012–2013 |
Reporting Period 2013–2014 |
Difference | |
|---|---|---|---|---|
| Completion of Requests | ||||
| Completion rate | 88.82% | 87.30% | -1.52% | |
| Completion Time | ||||
| % of requests completed within 30 days | 39.26% | 67.27% | 28.01% | |
| Average number of days to complete a request | 301 | 36.8 | -264.2 | |
| % of requests closed past statutory or extended deadline | 25.93% | 0.91% | -25.02 | |
| % of consultations from government institution completed within 30 days | 67.57% | 62.5% | -5.07% | |
| % of extensions of 30 days or less | 38.89% | 5.56% | -33.33% | |
| Level of Disclosure | ||||
| % of pages processed that were disclosed | 51.51% | 42.77% | -8.74% | |
| % of requests completed for which the information was disclosed entirely | 18.52% | 20.91% | 2.39% | |
| % of pages disclosed entirely | 8.88% | 19.22% | 10.34% | |
| Exemptions/Exclusions | ||||
| Number of exemptions/exclusions per request completed | 2.02 | 1.49 | -0.53 | |
Other activities
CPC’s ATIP office had set three objectives for the reporting period 2013–2014, being:
- Closing 95% of requests on time;
- Achieving a deemed refusal rate of 5%;
- Carrying over only current requests into 2014–2015.
It successfully reached these three objectives and even exceeded goals (1) and (2), by closing 99% of its requests on time and achieving a deemed refusal rate below 5%.
Complaints
In 2013–2014, the OIC received 10 new complaints against CPC.Footnote 4 This is similar to 2012–2013 (8 new complaints).
Of the complaints registered in 2013–2014, 2 were found to be well-founded, 1 not well-founded. An additional complaint was discontinued, while 6 complaints were still pending as of April 2015.
Footnotes
- Footnote 1
-
Based on response to parliamentary written question Q-485. CPC responded to the parliamentary written question Q-485 using calendar year data. We were later informed by CPC that the average number of days to complete a request for the fiscal year 2012-13 was 213 days.
- Footnote 2
-
This request was responded to within 15 days past the statutory deadline.
- Footnote 3
-
The 2007–2008 OIC report card grading system was used to estimate the grade: A=0 to 5%, B= 5 to 10%, C=10 to 15%, D=15% to 20%, F=more than 20%.
- Footnote 4
-
The numbers reported in this section are based on the OIC’s statistics. The information may not reflect the statistics reported by institutions due to the discrepancies in the methodology used.