
Statistics
In the last five years, complaints have ranged between 1.5% and 3% of all access requests.
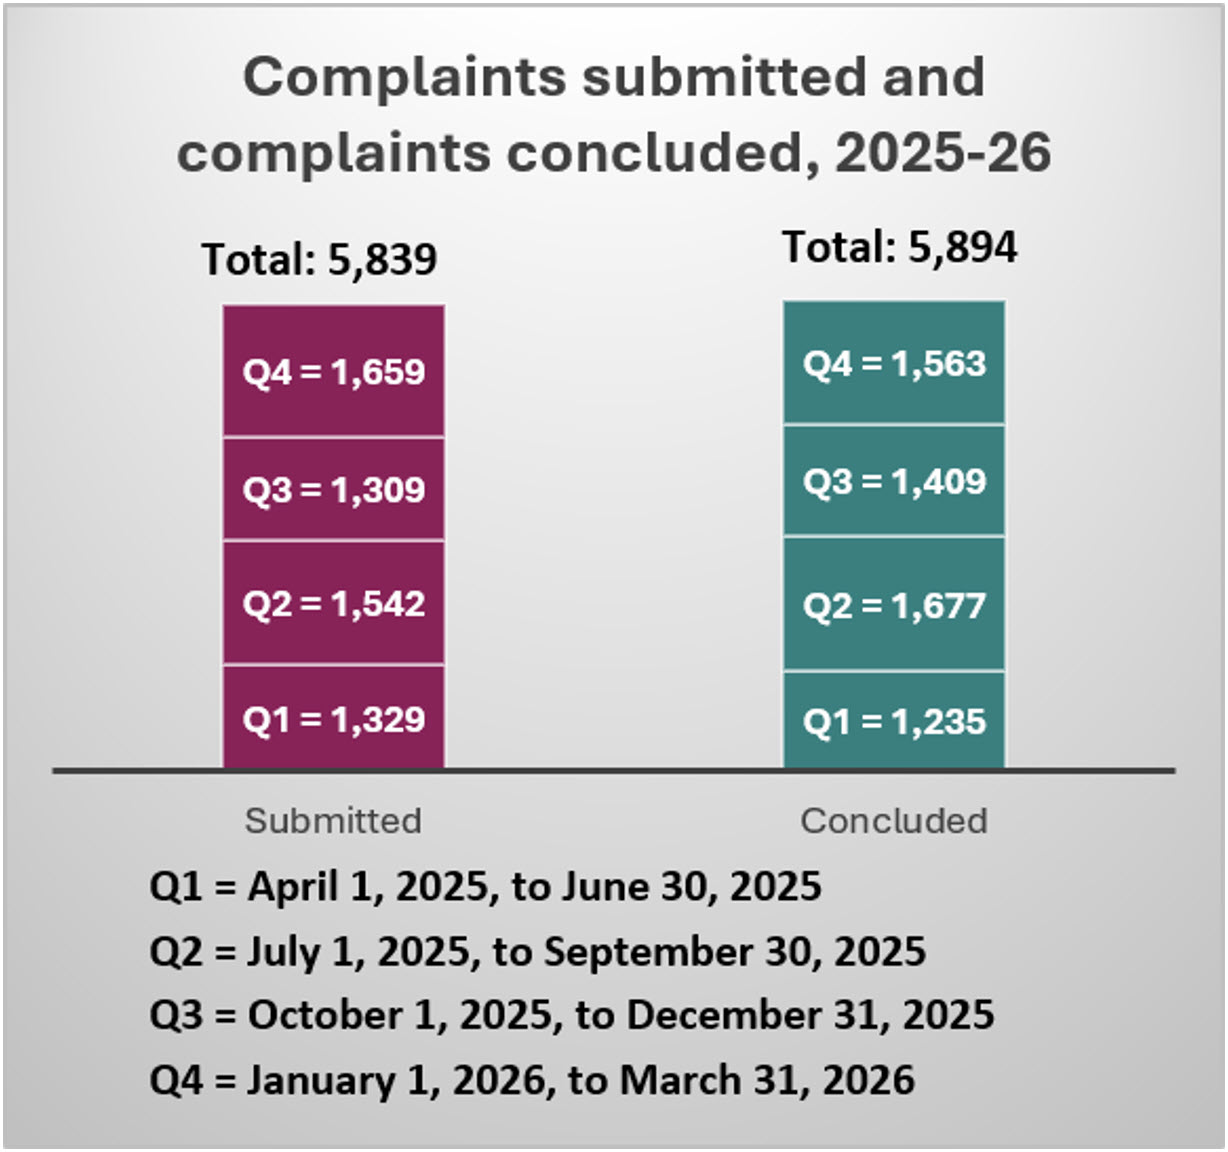
Text version
| Quarter | Complaints submitted | Complaints concluded |
|---|---|---|
Q4 | 1,659 | 1,563 |
Q3 | 1,309 | 1,409 |
Q2 | 1,542 | 1,677 |
Q1 | 1,329 | 1,235 |
In 2025-26, 5,839 complaints were submitted to the OIC.
- 47% - delay or extension of time complaints
- 20% - refusal complaints
- 33% - not admissible for investigation
The OIC concluded 5,894 complaints:
- 11% - well founded
- 9% - not well founded
- 14% - discontinued by the complainant
- 33% - ceased to investigate, most often because the complainant received a response to their access to information request as a result of the OIC’s work, making further investigation unnecessary
- 33% - concluded by Registry as they were received outside legislative time limits or were otherwise inadmissible
So far in 2026-27, as of May 1, 2026
- 405 complaints were deemed admissible (60% increase over the same period last year)
- 250 were concluded through investigations (20% increase over the same period last year)
Inventory
Total of 2,155 complaints (10% are more than 2 years old; goal is to stay under 15%)
| Top 5 institutions in inventory, as of March 31, 2026 | |
|---|---|
| Institution | Number (Percentage of complaints in inventory) |
Immigration, Refugees and Citizenship Canada | 305 (14.6%) |
Transport Canada | 216 (10%) |
Privy Council Office | 209 (9.7%) |
Global Affairs Canada | 116 (5.4%) |
Royal Canadian Mounted Police | 111 (5.2%) |
Complaints and orders
| Complaints and orders | 2020–21 | 2021–22 | 2022–23 | 2023–24 | 2024–25 | 2025-26 |
|---|---|---|---|---|---|---|
Complaints concluded through investigations | 4,060 | 6,787 | 8,089 | 4,183 | 4,108 | 3,955 |
Complaints concluded through investigations – Cease to investigate | 2,867 | 4,854 | 4,854 | 2,527 | 2,123 | 1,930 |
Complaints concluded by Registry | n/a | n/a | n/a | 1,497 | 1,298 | 1,939 |
Total complaints concluded | 4,060 | 6,787 | 8,089 | 5,680 | 5,406 | 5,894 |
Orders – delay and extension of time complaints | 2 | 25 | 135 | 275 | 329 | 288 |
Orders – refusal complaints | 0 | 2 | 22 | 35 | 46 | 52 |
Total orders issued | 2 | 27 | 157 | 310 | 375 | 340 |
% of orders issued – complaints concluded through investigations | 0.49% | 0.40% | 1.94% | 7.41% | 9.13% | 8.6% |
% of orders issued – all complaints concluded | 0.49% | 0.40% | 1.94% | 5.45% | 6.93% | 5.76% |
Orders and litigations
- Percentage of complaints with orders: 0.05% (2020–21) to 8.6% (2025–26) – average is about 5%
During FY 2025-26, 6 institutions sought judicial review, totaling 22 cases.
- As of April 30, 2026, there are currently 9 active files before the Federal Court.
| Federal Court reviews of Commissioner’s orders, 2025–26 | |||
|---|---|---|---|
| Institution | Delay complaint cases | Extension of time complaint cases | Refusal complaint cases |
Library and Archives Canada | 3 | 13 | |
Health Canada | 1 | ||
Privy Council Office | 1 | ||
Canada Mortgage and Housing Corporation | 1 | ||
Canadian Broadcasting Corporation | 1 | ||
Crown-Indigenous Relations and Northern Affairs Canada | 2 | ||
Applications from institutions for permission to decline to act on access requests
- Total of 92 applications received: 16 (17%) permissions were granted.
Criminal Offences
- Total of 6 cases referred to the Attorney General
Key developments and operational pressures within the access to information system (based on Treasury Board Secretariat’s Access to Information and Privacy Statistical Report for 2024-25 Fiscal Year)
Ongoing challenges in timely request completion
- More than 20% of requests were not closed within legislated timelines in 2024-25.
- When excluding Immigration, Refugees and Citizenship Canada (which received more than 80% of all requests), 35% of requests were not responded to within legislated timelines.
Fewer formal requests, but higher costs and more informal requests and pages processed
- Although the number of requests decreased in 2024-25, both the number of pages processed and the average cost per access request increased.
- Excluding IRCC, there was a 33% increase in pages processed compared with 2023-24.
- There was a significant rise in informal requests.
- For the second consecutive year, more requests were closed than received.
Media engagement rebounds
- When excluding IRCC, 16.5% of requests were made by media in 2024-25.
- This is in line with pre-pandemic levels.