2012-2013 Overall Performance
Observations on the health of the access system
2012-13
2012-13 Assessment
Enhanced statistical report
In her 2009 special report to Parliament, the Commissioner noted that the annual statistics the Treasury Board of Canada Secretariat (TBS) was collecting on access activities provided neither a detailed nor an accurate picture of institutional performance. The Commissioner made the case in her report (and reiterated it the following year) that TBS should gather more and better data to assess individual institution and system-wide performance. In response, TBS began collecting enhanced annual figures in 2011-12 and issued its first expanded statistical report in December 2012.
In her 2012-13 annual report, published in October 2013, the Commissioner expressed concerns about the apparent fragility of the access to information system. Complaints were up by 9 percentFootnote 1, and a large increase in administrative complaintsFootnote 2—about fundamental matters such as delays—showed that institutions were having difficulty meeting even their most basic obligations under the Access to Information Act.
The Commissioner noted that what she was observing was unique in her experience. The combination of the higher number of administrative complaints, institutions’ diminishing resources (in access offices as well as program areas) and the unwillingness of some institutions to collaborate in the course of the Commissioner’s investigations were all signs of deterioration in the system.
Three months later, in December 2013, the Treasury Board of Canada Secretariat (TBS) published under the Info Source program its annual compilation of statistical informationFootnote 3 about requests made under the Act. In contrast to what the Commissioner’s data were indicating, these figures for 2012-13 showed evidence of improved system-wide performance.
To get to the root of this divergence, and to gain greater insight into the health of the access system, the Commissioner conducted an assessment of the 2012-13 performance of the 24 institutionsFootnote 4 that received the most requests, complaints or both for that year.Footnote 5 Footnote 6 This analysis also allowed the Commissioner to continue to carry out her oversight activities, in the absence of her annual report cards, which she had suspended in May 2012.
The institutions the Commissioner examined were the following:
- Aboriginal Affairs and Northern Development Canada (AANDC)
- Canada Border Services Agency (CBSA)
- Canada Post Corporation (CPC)
- Canada Revenue Agency (CRA)
- Canadian Broadcasting Corporation (CBC)
- Canadian Food Inspection Agency (CFIA)
- Citizenship and Immigration Canada (CIC)
- Correctional Service Canada (CSC)
- Department of Justice Canada (JUS)
- Employment and Social Development Canada (ESDC)
- Environment Canada (EC)
- Fisheries and Oceans Canada (DFO)
- Foreign Affairs, Trade and Development Canada (DFATD)
- Health Canada (HC)
- Industry Canada (IC)
- Library and Archives Canada (LAC)
- National Defence (ND)
- Natural Resources Canada (NRCan)
- Privy Council Office (PCO)
- Public Safety Canada (PS)
- Public Works and Government Services Canada (PWGSC)
- Royal Canadian Mounted Police (RCMP)
- Transport Canada (TC)
- Treasury Board of Canada Secretariat (TBS).
The Commissioner’s main conclusion after a review of all the publicly available information on the institutions access performance is that their performance continues to be fragile, with some institutions performing well and others poorly, and that the performance of institutions is often volatile over a number of years.
What follows is an analysis of the figures for the 24 institutions based on the volume of requests received and using indicators of the timeliness of responses to requests, and of disclosure of information. A summary of each institution’s performance is appended to this document, with more details on individual institutions available on the Commissioner’s website.
Source of requests, 2012-13
- Public: 22,274 (40 percent)
- Business: 21,242 (38.5 percent)
- Media: 8,321 (15.1 percent)
- Organization: 2,415 (4.4 percent)
- Academia: 983 (2 percent)
Context
The Info Source statistics reveal a large increase (27.7 percent) in the number of access requests institutions received in 2012-13 compared to 2011-12. The Commissioner’s complaints volume echoed this: it increased by 9 percent in 2012-13 and by 30 percent in 2013–2014.
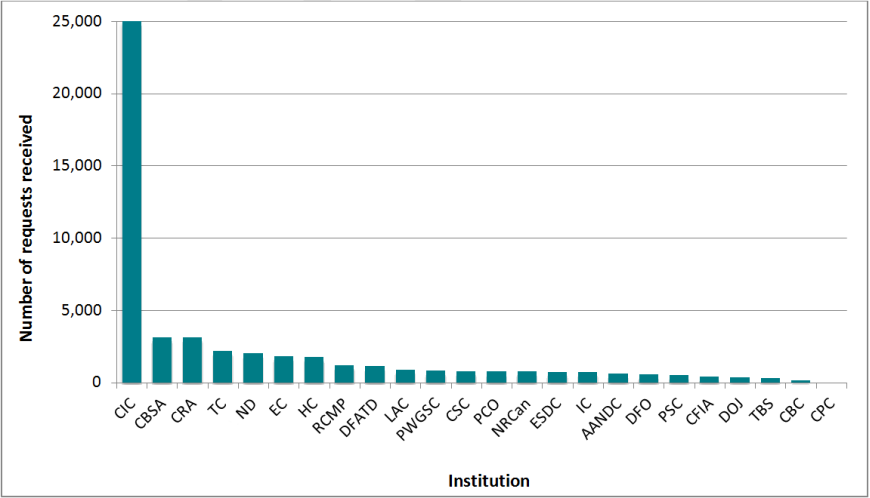
The jump in access requests was largely due to the growing interest of members of the public in exercising their right to know. Going back a decade, 2012-13 was the first time in recent years that the public was the most frequent source of requestsFootnote 7 (see, “Source of requests, 2012-13,” above). See Figure 1 for the number of requests each of the 24 institutions received in 2012-13.
Figure 1. Number of requests received, 24 institutions, 2012-13
Source: Individual institutions’ annual report to Parliament on the administration of the Access to Information Act
Text version
Figure 1 is a bar chart with 24 vertical bars, each representing one of the 24 analyzed institutions (x-axis) and the number of requests they received (y-axis) in 2012-13. The results are as follows:
| Institution | Number of requests received |
|---|---|
| Citizenship and Immigration Canada | 25,010 |
| Canada Border Services Agency | 3,147 |
| Canada Revenue Agency | 3,137 |
| Transport Canada | 2,197 |
| National Defence | 2,044 |
| Environment Canada | 1,827 |
| Health Canada | 1,765 |
| Royal Canadian Mounted Police | 1,218 |
| Department of Foreign Affairs, Trade and Development | 1,148 |
| Library and Archives Canada | 900 |
| Public Works and Government Services Canada | 810 |
| Correctional Service Canada | 785 |
| Privy Council Office | 780 |
| Natural Resources Canada | 769 |
| Employment and Social Development Canada | 746 |
| Industry Canada | 741 |
| Aboriginal Affairs and Northern Development Canada | 648 |
| Department of Fisheries and Oceans | 547 |
| Public Safety Canada | 494 |
| Canadian Food Inspection Agency | 405 |
| Department of Justice | 343 |
| Treasury Board Secretariat | 301 |
| Canadian Broadcasting Corporation | 154 |
| Canada Post Corporation | 105 |
The CIC effect
Citizenship and Immigration Canada (CIC) receives by far the most requests in the entire federal access system—45 percent of the total in 2012-13.
Nearly all the requests it receives are from consultants and lawyers representing non-citizens who deal with CIC on matters of immigration and citizenship. Typically, these requests involve a small number of pages. CIC is generally able to complete these requests within 30 days.
To get a more accurate picture of the performance of the access system, the Commissioner looked at the various system-wide statistics with and without the figures for CIC.
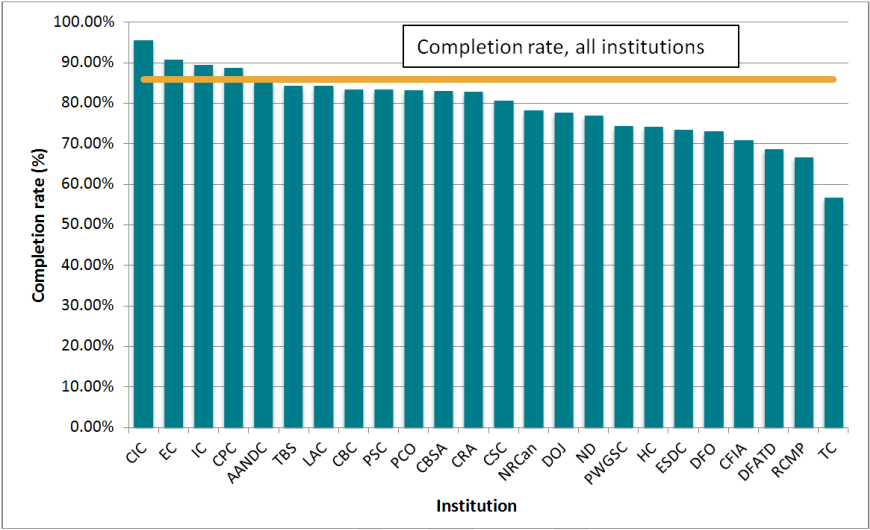
The 2012-13 government-wide statistics show that, in general, institutions were able to absorb the influx in requests. In fact, the overall completion rate for requests increased from 85.1 percent in 2011-12 to 85.9 percent in 2012-13Footnote 8. The completion rate is calculated by dividing the number of requests completed in the year by the total number of requests in inventory (new requests received that year and requests carried over from previous years). A high completion rate signals a small number of requests to be carried forward into the next reporting year (also known as the backlog). In the Commissioner’s experience, the creation of a large backlog can hinder institutional performance for years to come.
As Figure 2 shows, only four institutions in the group of 24 institutions analyzed obtained a completion rate higher than the average of all institutions: CIC (95.6 percent), Environment Canada (90.73 percent), Industry Canada (89.5 percent), and Canada Post (88.8 percent). All these institutions received more requests in 2012-13 than they had the year before, yet they were able to complete a large portion of them within the span of 2012-13.
Transport Canada (56.7 percent), the RCMP (66.7 percent) and DFATD (68.6 percent) had the lowest completion rates in the group. For its part, Transport Canada received 272 percent more requests in 2012-13 than it had the year before.Footnote 9 In contrast, the RCMP received 15-percent fewer requests.
Figure 2. Completion rate, 24 institutions, 2012-13
Source: Individual institutions’ annual report to Parliament on the administration of the Access to Information Act
Text version
Figure 2 is a bar chart with 24 vertical bars, each representing one of the 24 analyzed institutions (x-axis) and the completion rate (in %) that they achieved (y-axis) in 2012-13. The completion rate is expressed as a percentage of requests in inventory that was closed during the same reporting period. The results are as follows:
Institution Completion rate (%) Citizenship and Immigration Canada 95.57% Environment Canada 90.73% Industry Canada 89.49% Canada Post Corporation 88.82% Aboriginal Affairs and Northern Development Canada 85.23% Treasury Board Secretariat 84.38% Library and Archives Canada 84.28% Canadian Broadcasting Canada 83.52% Public Safety Canada 83.42% Privy Council Office 83.24% Canada Border Services Agency 83.05% Canada Revenue Agency 82.90% Correctional Service Canada 80.73% Natural Resources Canada 78.34% Department of Justice 77.64% National Defence 76.98% Public Works and Government Services Canada 74.38% Health Canada 74.27% Employment and Social Development Canada 73.43% Department of Fisheries and Oceans 73.18% Canadian Food Inspection Agency 71% Department of Foreign Affairs, Trade and Development 68.63% Royal Canadian Mounted Police 66.73% Transport Canada 56.74% A horizontal line is drawn across the bar chart to show the average completion rate across the government, which is 85.92%.
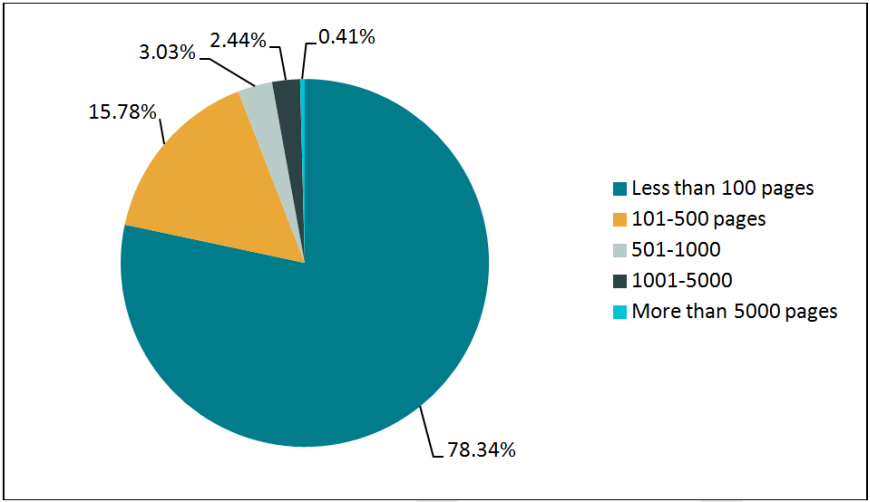
Institutions often refer to the volume of pages processed as a measure of the complexity of requests, and can be a factor in how long it takes to complete requests. As Figure 3 shows, the vast majority of requests completed in 2012-13 required institutions to process fewer than 100 pages.Footnote 10 Requests involving more than 1,000 pages represented only 2.85 percent of all requests.Footnote 11 Library and Archives had the highest proportion of these requests, at 17.96 percent.
Figure 3. Number of pages processed per request, all institutions, 2012-13
Source: Info Source Bulletin number 36b- Access to Information and Privacy Statistical Reporting, 2012-13
(http://infosource.gc.ca/bulletin/2013/b/bulletin36btb-eng.asp)
Text version
Figure 3 is a pie chart that gives the proportion of government-wide requests closed during the reporting period 2012-13, by the number of pages processed. There are 5 categories: less than 100 pages, 101-500 pages, 501-1,000, 1,001-5,000 and more than 5,000 pages. About 78.34% of the requests required the processing of 100 pages or less. The remaining proportion of requests closed is shared among the other categories as follows:
- 101-500 pages: 15.78%
- 501-1,000 pages: 3.03%
- 1,001-5,000 pages: 2.44%
- More than 5,000 pages: 0.41%
Looking at individual institutions analyzed, some processed large volumes of pages during 2012-13. These included Industry Canada (2,828,056), the RCMP (1,252,447) and CRA (1,203,253). Together, they represent 37.56 percent of all pages processed in 2012-13.
Timeliness of responses to requests
Timeliness is the basis of an effective access to information system. This was reaffirmed with the passage of the Federal Accountability Act in 2006, which introduced a duty to respond to requests in a timely fashion (subsection 4(2.1) of the Access to Information Act).
Under section 9 of the Act, institutions have 30 days to complete a request unless they meet the limited requirements for taking a time extension: the need to search for and through a large volume of records, which results in interference with operations, and the need to consult with other institutions or third parties about records that fall within the scope of requests.
Using publicly available information, the Commissioner looked at four indicators to assess institutions’ timeliness when responding to access requests:
- the number of requests completed within 30 days;
- the proportion of requests completed past the statutory deadline;
- the average time to complete requestsFootnote 12; and
- how long it took institutions to complete requests after the 30-day or extended deadline had passed.
a) Number of requests completed within 30 days
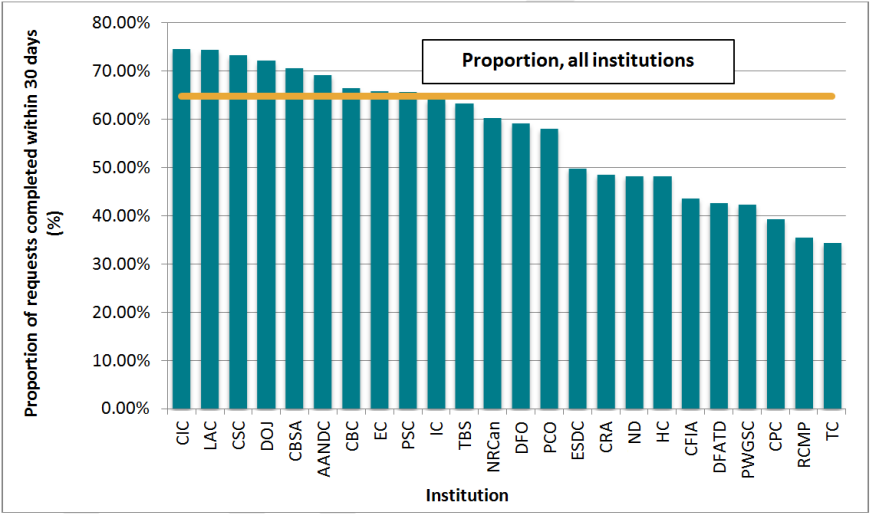
The proportion of requests institutions respond to within 30 days is an important indicator because it sheds light on the number of requests completed without the need for a time extension. In 2012-13, institutions completed 64.8 percent of requests within 30 days. This compares favourably to the 55.3 percent 30-day completion rate for 2011-12Footnote 13.
However, the aggregated Info Source data does not provide the level of detail required to compare and contrast the performance of institutions. Looking at the figures each institution provided in their annual report (Figure 4), only 9 out of the 24 institutions were able to outpace the system-wide 30-day completion rate.
Figure 4. Proportion of requests completed within 30 days, 24 institutions, 2012-13
Source: Individual institutions’ annual report to Parliament on the administration of the Access to Information Act
Text version
Figure 4 is a bar chart with 24 vertical bars, each representing one of the 24 analyzed institutions (x-axis) and the percentage of requests that they completed within 30 days (y-axis) during the reporting period 2012-13. The results are as follows:
| Institution | Proportion of requests completed within 30 days (%) |
|---|---|
| Citizenship and Immigration Canada | 74.62% |
| Library and Archives Canada | 74.37% |
| Correctional Service Canada | 73.31% |
| Department of Justice | 72.14% |
| Canada Border Services Agency | 70.67% |
| Aboriginal Affairs and Northern Development Canada | 69.18% |
| Canada Broadcasting Canada | 66.45% |
| Environment Canada | 65.91% |
| Public safety Canada | 65.69% |
| Industry Canada | 64.19% |
| Treasury Board Secretariat | 63.27% |
| Natural Resources Canada | 60.26% |
| Department of Fisheries and Oceans | 59.16% |
| Privy Council Office | 58.07% |
| Employment and Social Development Canada | 49.84% |
| Canada Revenue Agency | 48.52% |
| National Defence | 48.29% |
| Health Canada | 48.19% |
| Canadian Food Inspection Agency | 43.66% |
| Department of Foreign Affairs, Trade and Development | 42.69% |
| Public Works and Government Services Canada | 42.31% |
| Canada Post Corporation | 39.26% |
| Royal Canadian Mounted Police | 35.47% |
| Transport Canada | 34.39% |
A horizontal line is drawn across the graphic to show the average percentage of requests completed within 30 days across the government, which is 64.82%.
The five institutions from the top 24 institutions that responded to the largest proportion of their requests within 30 days were CIC (74.62 percent), LAC (74.37 percent), CSC (73.31 percent), the Department of Justice Canada (72.14 percent) and CBSA (70.67 percent). Together, these institutions accounted for 57.1 percent of all requests completed in 2012-13.
The three institutions among the 24 with the lowest 30-day completion rate were Canada Post Corporation (39.26 percent), the RCMP (35.47 percent) and Transport Canada (34.39 percent). Together, these institutions accounted for 4.7 percent of all requests completed in 2012-13.
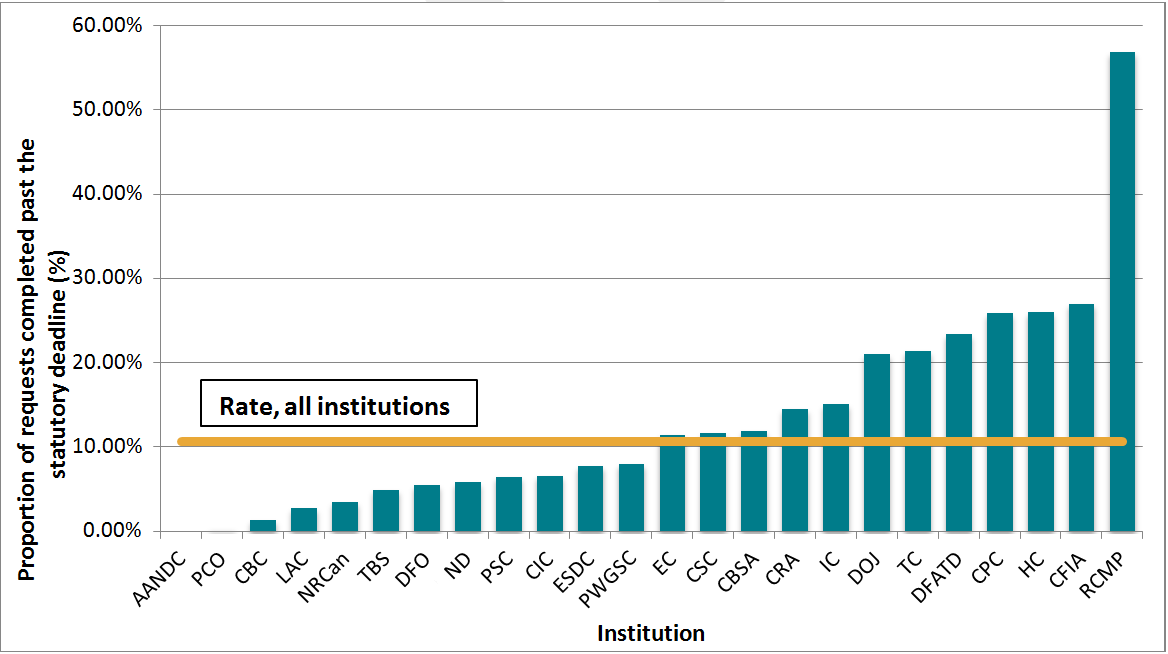
b) Proportion of requests completed past the statutory deadline
The proportion of requests completed past the statutory deadline measures how well institutions meet the 30-day or extended deadlines for responding to requests. The goal for institutions is to have as few late requests as possible. In all her report cards since 2008-09, the Commissioner has recommended that institutions strive to attain a deemed refusal rate of zero—that is, that they answer all their requests on or before their due date.Footnote 14
TBS started to collect statistics in 2011-12 on the number of requests institutions complete after their due date, based on requests completed during the year. These represent the number of requests closed late, including those completed after 30 days with no extension and those completed after their extension has expired.
Looking at the government-wide figures for 2012-13, institutions responded 10.7-percent of requests after their due date, an improvement over the 14.9-percent figure from 2011-12. This earns the federal access to information system a “C” grade under the Commissioner’s rating system.Footnote 15 Footnote 16
Looking at the figures for each of the 24 institutions, the proportion of requests completed past the statutory deadline vary significantly, from a perfect score of zero to a very high rate of nearly 57 percent. Half the institutions were able to obtain a lower rate than the one achieved government-wide (Figure 5).
Figure 5. Proportion of requests completed past the statutory deadline, 24 institutions, 2012-13
Source: Individual institutions’ annual report to Parliament on the administration of the Access to Information Act
Text version
Figure 5 is a bar chart with 24 vertical bars, each representing one of the 24 analyzed institutions (x-axis). The y-axis displays the proportion, in percentage, of requests completed past the statutory deadline during the reporting period 2012-13 for each of the 24 institutions. The results are as follows:
| Institution | Proportions of requests completed past the statutory deadline (%) |
|---|---|
| Aboriginal Affairs and Northern Development Canada | 0 |
| Privy Council Office | 0.28% |
| Canadian Broadcasting Corporation | 1.32% |
| Library and Archives Canada | 2.75% |
| Natural Resources Canada | 3.49% |
| Treasury Board Secretariat | 4.94% |
| Department of Fisheries and Oceans | 5.52% |
| National Defence | 5.82% |
| Public Safety Canada | 6.49% |
| Citizenship and Immigration Canada | 6.61% |
| Employment and Social Development Canada | 7.78% |
| Public Works Government Services Canada | 8% |
| Environment Canada | 11.49% |
| Correctional Service Canada | 11.66% |
| Canada Border Services Agency | 11.93% |
| Canada Revenue Agency | 14.53% |
| Industry Canada | 15.12% |
| Department of Justice | 21.05% |
| Transport Canada | 21.42% |
| Department of Foreign Affairs, Trade and Development | 23.43% |
| Canada Post Corporation | 25.93% |
| Health Canada | 26.05% |
| Canadian Food Inspection Agency | 27.04% |
| Royal Canadian Mounted Police | 56.94% |
A horizontal line is drawn across the bar chart to show the average proportion of requests completed past the statutory deadline, which is of 10.67%.
Six institutions had a percentage of less than 5 percent (and thus an “A” grade) in 2012-13: AANDC, PCO, the CBC, LAC, NRCan and TBS.
AANDC achieved a percentage of zero, despite receiving 37.9 percent more requests in 2012-13 than it had the year before.
Despite seeing a 46-percent increase in requests compared to 2011-12, PCO completed just 0.28 percent of the requests it passed their due date.
The CBC's proportion of requests completed past the statutory deadline in 2012-13 was 1.32 percent.
Three other institutions scored a rating of “A” in 2012-13: LAC (2.75 percent), NRCan (3.49 percent) and TBS (4.94 percent).Footnote 17
Seven institutions received an “F” or worse (proportion of requests completed past the statutory deadline of more than 20 percent) in 2012-13.Footnote 18 These institutions all cited “workload” as the predominant reason they responded late to requests.
Based on our experience and past report card exercises, it has proven difficult for institutions to reach or maintain strong compliance with the requirements of the Access to Information Act. Without constant efforts and attention, it is clear that institutional performance, even among top performers, can slip. No institution is immune to an increase in workload, a change in leadership, high staff turnover or budget cuts, which can have devastating impacts on compliance with access to information requirements. However, experience has shown that how institutions respond to these challenges will affect their compliance with their obligations under the Act in future years.
A note on time extensions
The proportion of requests completed past the statutory deadline only provides an indication of the proportion of requests institutions completed past their due date. It does not take into consideration the length of time extensions taken that prolong the response time, and may, in turn, help institutions improve their proportion of requests completed past the statutory deadline.
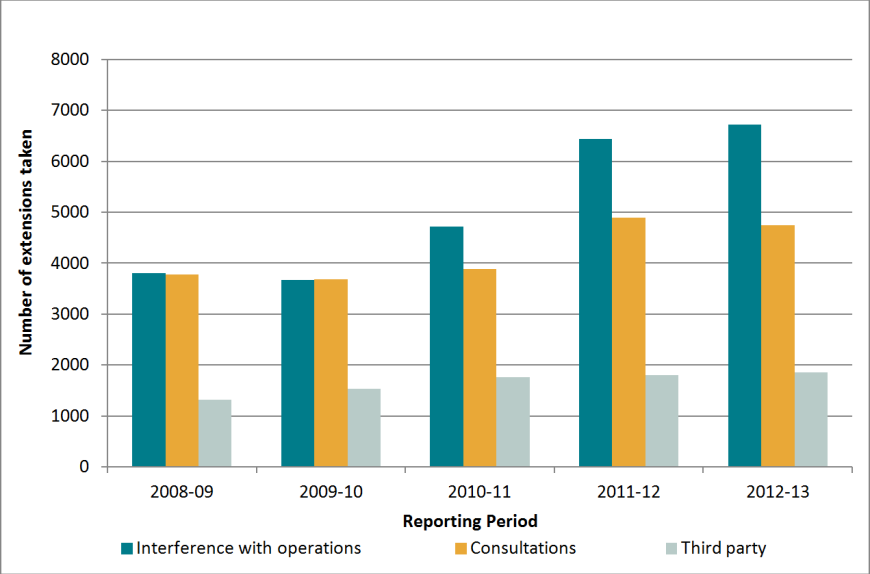
The Commissioner’s investigations have shown that institutions, in some instances, may use time extensions to cope with heavy workloads or to manage internal approval processes. Under these circumstances, the Commissioner expects to see an increase in the number of extensions institutions take under paragraph 9(1)(a) of the Act (searching for and through a large volume of records, which results in interference with operations). As is clear in Figure 6, government-wide statistics show an increase in the use of this extension over time. However, this increase in 2012-13 is less significant than the overall increase in requests.
Figure 6. Time extensions by category, all institutions, 2008-09 to 2012-13
Source: Info Source Bulletin number 36b- Access to Information and Privacy Statistical Reporting, 2012-13
(http://infosource.gc.ca/bulletin/2013/b/bulletin36btb-eng.asp)
Text version
Figure 6 is a bar chart with vertical bars that represent the number of government-wide extensions (y-axis) taken for each of the categories (interference with operations, consultations and third party) and for the reporting periods 2008/09, 2009/10, 2010/11, 2011/12 and 2012/13 (axis X). Results are as follows:
| Type of extensions | 2008-2009 | 2009-2010 | 2010-2011 | 2011-2012 | 2012-2013 |
|---|---|---|---|---|---|
| Interference with operations | 3,802 | 3,669 | 4,714 | 6,442 | 6,715 |
| Consultations | 3,775 | 3,686 | 3,880 | 4,894 | 4,746 |
| Third party | 1,313 | 1,539 | 1,759 | 1,801 | 1,860 |
The Commissioner received 9 percent more notices about time extensions of more than 30 days in 2012-13 than she did the year before (Table 1). Interestingly, based on Info Source statistics, the number of extensions for more than 30 days, for completed requests in 2012-13, decreased by 10 percent.Footnote 19 Footnote 20
Table 1. Extension notices received and length of extensions, all institutions, 2011-12 and 2012-13
| 2011-12 | 2012-13 | |
|---|---|---|
| Number of notices received | 5,589 | 6,114 |
Source: Office of the Information Commissioner: http://www.oic-ci.gc.ca/eng/extension-notice-prorogation-de-delai-2012-13.aspx
Transport Canada (rated “F”, see Appendix), for example, sent 340 percent more notices during 2012-13 than 2011-12. For CSC (rated “C”, see Appendix), the number of notices increased by 257 percent. PCO (rated “A”, see Appendix) sent 91 percent more notices.
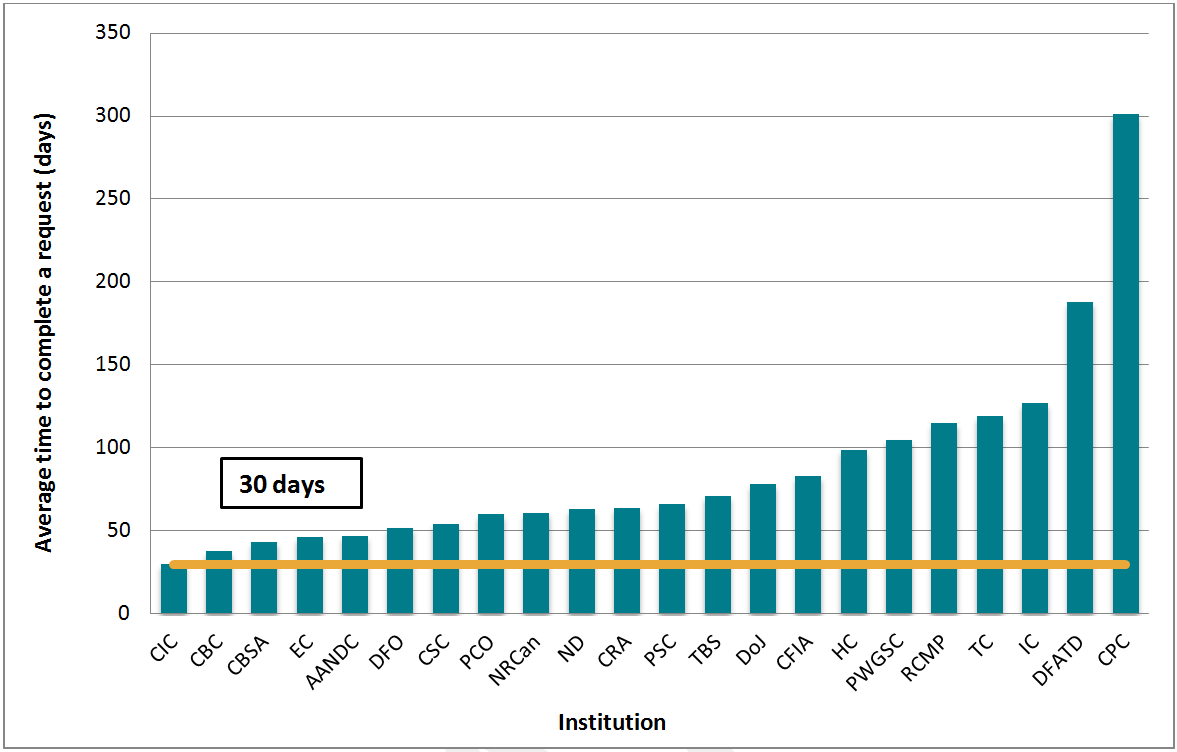
c) Average time to complete a request
The average time to complete a request is not collected by the Treasury Board of Canada Secretariat.Footnote 21 However, the information was requested by a Member of Parliament in written question Q-485.Footnote 22 This information is interesting because it gives an additional level of information about the institution’s response time. However, the complexity of requests has an obvious impact on the time an institution takes to process those requests, as do consultations and the volume of pages to review.
Figure 7. Average time to complete a request, 24 institutions, 2012-13
Source: Response to parliamentary question Q-485.
Text version
Figure 7 is a bar chart with 22 vertical bars representing each of the analyzed institutions. The x-axis displays the average time, in days, that each institution took to complete a request during the reporting period 2012/13. The results are as follows:
| Institution | Average time to complete a request (in days) |
|---|---|
| Citizenship and Immigration Canada | 30 |
| Canadian Broadcasting Corporation | 38 |
| Canada Border Services Agency | 43.5 |
| Environment Canada | 46 |
| Aboriginal Affairs and Northern Development Canada | 47 |
| Department of Fisheries and Oceans | 52 |
| Correctional Services Canada | 54.4 |
| Privy Council Office | 60 |
| Natural Resources Canada | 61 |
| National Defence | 63.1 |
| Canada Revenue Agency | 64 |
| Public Safety Canada | 66 |
| Treasury Board Secretariat | 71 |
| Department of Justice | 78 |
| Canadian Food Inspection Agency | 83 |
| Health Canada | 99 |
| Public Works and Government Services Canada | 105 |
| Royal Canadian Mounted Police | 115 |
| Transport Canada | 119 |
| Industry Canada | 127 |
| Department of Foreign Affairs, Trade and Development | 188 |
| Canada Post Corporation | 301 |
As shown in Figure 7, all but one institution took more than 30 days on average to respond to requesters. The average is between 31 to 60 days for 7 institutions, 61-90 days for 7 institutions, 91-120 days for 4 institutions and more than 120 days for 3 institutions.
d) Length of time institutions took to respond to overdue requests
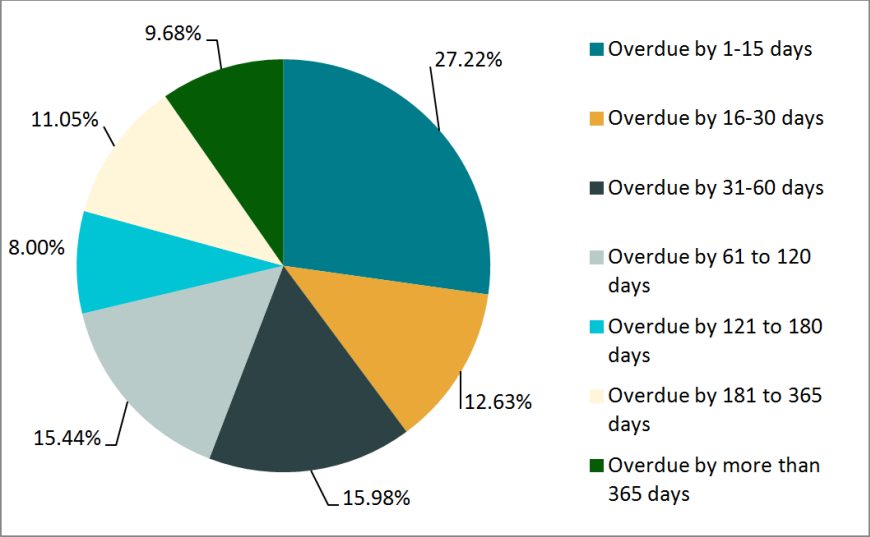
Finally, to conclude the review of timeliness, the Commissioner looked at the number of requests institutions responded to after 30 days or the extended deadline had passed. This measure is an indicator of institutions’ commitment to complete late requests as quickly as possible (as per their duty to assist requesters), which is of importance because the Act otherwise contains no incentive for institutions to respond promptly.
As shown in Figure 8, nearly 10 percent of all late requests completed in 2012-13 took at least an extra year to close, after either the initial 30 days or an extension had expired.
Figure 8. Lateness of overdue requests, all institutions, 2012-13
Source: Info Source Bulletin number 36b- Access to Information and Privacy Statistical Reporting, 2012-13: (http://infosource.gc.ca/bulletin/2013/b/bulletin36btb-eng.asp)
Text version
Figure 8 is a pie chart representing all institutions. It charts the amount of days taken to close requests past the statutory deadline during the reporting period 2012/13. Results are presented as a percentage of all requests closed past their statutory deadline. The categories and proportions are as follows:
| Number of days overdue | Proportion of requests closed |
|---|---|
| Overdue by 1-15 days | 27.22% |
| Overdue by 16-30 days | 12.63% |
| Overdue by 31-60 days | 15.98% |
| Overdue by 61 to 120 days | 15.44% |
| Overdue by 121 to 180 days | 8.00% |
| Overdue by 181 to 365 days | 11.05% |
| Overdue by more than 365 days | 9.68% |
In conclusion, although the government-wide statistics for 2012-13 show significant improvement in the timeliness of federal institutions’ responses to access requests, the Commissioner’s analysis of the 24 individual institution’s performance statistics tells a different story, one of mixed results. Only part of the 24 institutions was able to obtain better results than the government-wide figures.
The Commissioner’s analysis also shows the impact of the performance of Citizenship and Immigration Canada on overall results. When figures for this institution are excluded from the calculations, it is impossible to conclude that the performance of the remaining institutions improved overall.
Although many institutions that received mild to moderate increases in the number of access requests were able to absorb the increase without a noticeable impact on their performance, others could not, or were unable to cope with a large jump in request volume. This, and the declining performance of a number of institutions, highlights the fragility of the system and the volatility of performance from year to year.
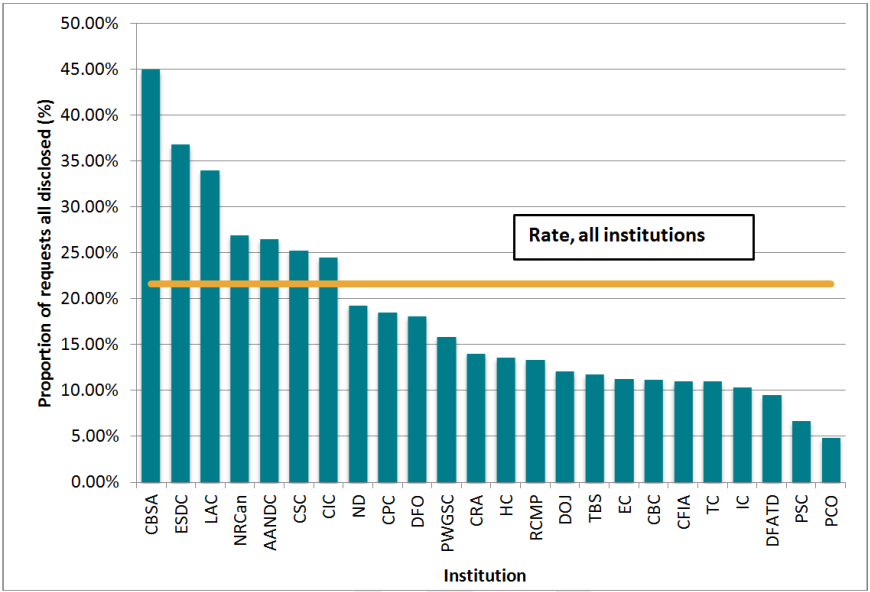
Disclosure
As part of her analysis, the Commissioner also looked at the amount of information institutions disclosed to requesters in 2012-13. The system-wide figures show that there was only a very small improvement in the number of requests for which all information was disclosed in 2012-13 (21.6 percent) compared to 2011-12 (21.2 percent).Footnote 23
Figure 9. All information disclosed, 24 institutions, 2012-13
Source: Individual institutions’ annual report to Parliament on the administration of the Access to Information Act
Text version
Figure 9 is a graphic of 24 vertical bars representing each of the analyzed institutions. The y-axis displays the proportion, in percentage, of completed requests during the reporting period 2012/13 for which all the information was disclosed. The results are as follows:
| Institution | Proportion of requests closed where all information was disclosed (%) |
|---|---|
| Canada Border Services Agency | 44.97% |
| Employment and Social Development Canada | 36.83% |
| Library and Archives Canada | 33.98% |
| Natural Resources Canada | 26.93% |
| Aboriginal Affairs and Northern Development Canada | 26.48% |
| Correctional Services Canada | 25.28% |
| Citizenship and Immigration Canada | 24.52% |
| National Defence | 19.25% |
| Canada Post Corporation | 18.52% |
| Department of Fisheries and Oceans | 18.10% |
| Public Works and Government Services Canada | 15.87% |
| Canada Revenue Agency | 14.04% |
| Health Canada | 13.56% |
| Royal Canadian Mounted Police | 13.35% |
| Department of Justice | 12.07% |
| Treasury Board Secretariat | 11.73% |
| Environment Canada | 11.27% |
| Canadian Broadcasting Corporation | 11.18% |
| Canadian Food Inspection Agency | 10.99% |
| Transport Canada | 10.99% |
| Industry Canada | 10.35% |
| Department of Foreign Affairs, Trade and Development | 9.49% |
| Public Safety Canada | 6.69% |
| Privy Council Office | 4.83% |
A horizontal line is drawn across the bar chart to show the average of completed request for the information was disclosed entirely across the government, which is 21.63%.
Once again, there is a large variation among institutions. For example, CBSA disclosed all requested records in 44.97 percent of cases, while PCO did in only 4.83 percent (see Figure 8). While the Commissioner would like, in future years, to see more institutions than seven out of 24 exceed the system-wide rate for full disclosure, she acknowledges that the amount of information any one institution can disclose is closely related to the sensitivity of its holdings. The exemptions scheme under the Act is overly broad and, in many instances, prohibits institutions from disclosing information (for example, mandatory exemptions for information related to personal information). This scheme needs to be reviewed. In other instances, as the Commissioner’s investigations demonstrate, institutions apply exemptions too broadly at times.
Moreover, in the context of the government’s commitment to Open Government, institutions should disclose much more information proactively than they currently do. In their annual reports, most institutions noted that they treated more requests informally in 2012-13 than they had in previous years. In many instances, these informal requests were for disclosure packages from previous requests, the summaries of which are posted online. This is a positive development.
Footnotes
- Footnote 1
-
As noted in the Annual Report, the institutions that received the most complaints in 2012-13 are Canada Revenue Agency (336 complaints), Royal Canadian Mounted Police (125 complaints) and Citizenship and Immigration Canada (109 complaints).
- Footnote 2
-
As noted in the Annual Report, the institutions that received the most administrative complaints in 2012-13 are Canada Revenue Agency (109 complaints), Royal Canadian Mounted Police (76 complaints) and Foreign Affairs, Trade and Development Canada (35 complaints).
- Footnote 3
-
These statistics are available at http://www.infosource.gc.ca.
- Footnote 4
-
These 24 institutions represented about 91% of the total number of requests completed in 2012-13.
- Footnote 5
-
To determine the list of institutions, the office looked at institutions that received the most requests over the last 3 years and the top 20 institutions that received the most complaints over the same period. In merging these lists, we identified 24 institutions.
- Footnote 6
-
The top 24 institutions will be compared, throughout the analysis, to “all institutions”. The expression “All institutions” refers to all institutions subject to the Access to information Act.
- Footnote 7
-
Based on publicly available information going back to 1997-98, members of the public made the most requests as a category in 1997-98 and 1998-99.
- Footnote 8
-
This is partly explained with CIC’s completion rate. When excluding CIC, the completion rate goes down from 80.5 percent in 2011-12 to 78.6 percent in 2012-13.
- Footnote 9
-
This increase preceded the Lac-Mégantic catastrophe, which happened in July 2013 and resulted in Transport Canada subsequently receiving more than 200 requests about it (as of March 31, 2014; see 2013-2014 Annual Report of the Information Commissioner, page 5). The 2012-13 reporting period is also before the Canadian International Development Agency merged with DFATD.
- Footnote 10
-
78.3 percent with CIC; 69.6 percent without CIC.
- Footnote 11
-
5.73 percent without CIC.
- Footnote 12
-
TBS does not require institutions to provide this information. However, pursuant to a response to the parliamentary written question Q-485, this information is available for most institutions.
- Footnote 13
-
When the figures for CIC are excluded, the rate was 57.4 percent in 2011-12 and 55.7 percent for 2012-13.
- Footnote 14
-
When the Commissioner calculated the deemed-refusal rate in her report cards, she also included overdue requests still open at year-end; However, TBS does not collect this information. Therefore, the proportion of requests completed past the statutory deadline is only for requests closed.
- Footnote 15
-
As per the rating scale in the Commissioner’s 2007-08 report cards: A=0–5 percent; B=5–10 percent; C=10–15 percent; D=15–20 percent; and F=more than 20 percent. “Red alert” is reserved for very high proportions of requests completed past the statutory deadline.
- Footnote 16
-
When excluding the figures from CIC, the proportion of requests completed past the statutory deadline improved from 16.1 percent in 2011-12 to 14.5 percent in 2012-13, but still a “C” grade.
- Footnote 17
-
For all these institutions, the ratio extensions/completed requests is higher than the average for all institutions combined, indicating a wider use of time extensions.
- Footnote 18
-
Canada Post, CFIA, JUS, DFATD, Health Canada, RCMP, Transport Canada.
- Footnote 19
-
Info Source statistics consider completed requests during the reported period whereas the extension notices are for all requests extended during the reported period. The Office received a large number of extension notices in the last quarter of 2012-13. The requests associated to these extension notices were likely still ongoing at the end of the reporting period 2012-13.
- Footnote 20
-
The Commissioner records all extensions notices received by fiscal year. This differs from Info Source, under which institutions are required to provide information only about extensions associated with requests closed during the year.
- Footnote 21
-
In the 2007-08 Special Report on Report Cards, the Information Commissioner recommended to the Treasury Board Secretariat to collect additional statistics, including the average time to complete a request. Although TBS greatly expanded the annual statistics it collects annually, these statistics do not include the average time to complete a request.
- Footnote 22
-
Among the 24 institutions, LAC and ESDC did not provide an average in response to Q-485.
- Footnote 23
-
Excluding the figures for CIC, the proportion is 18.95 percent, compared to 18.2 in 2011-12.