2012-2013 1. Improving service delivery
Providing exemplary service to Canadians who complain to us about how institutions have handled their access to information requests is our overarching goal. With a legislative mandate to investigate all complaints that come to us, we strive each year to respond effectively and efficiently to changes in our workload.
We received 9-percent more complaints in 2012–2013 (1,596) than we did the year before (Figure 1). We also saw the number of new administrative complaints increase by 42 percent from 2011–2012 (Figure 2). This was a reversal of the trend we had observed in the three previous fiscal years, when administrative complaints had been in decline. Administrative complaints involve delays, time extensions, fees and miscellaneous matters.
Moreover, out of the top 15 institutions about which we received administrative complaints, only one was the subject of fewer administrative complaints in 2012–2013 than in the year before (Figure 3). In fact, the number of administrative complaints against six institutions more than doubled, with one being the focus of six times as many complaints. This is a sign of clear deterioration in the access to information system and indicates that institutions are having difficulty meeting even their basic obligations under the Access to Information Act, such as adhering to the legislative deadlines for responding to requests or following proper procedures for taking time extensions.
Facts and figures of interest
We received 1,596 complaints in 2012–2013, a 9-percent increase from the year before.
We received 42-percent more administrative complaints in 2012–2013, compared to 2011–2012.
We closed 1,622 complaints, an 8-percent increase from 2011–2012.
We have reduced our inventory of complaints by 28.6 percent since April 1, 2009, and closed an average of 1,824 files annually from 2009–2010 to 2012–2013.
In 2012–2013, we closed 57 percent of complaints within nine months from the date we registered them, compared to 49 percent the year before.
We closed 70 percent of administrative complaints within 90 days from date of assignment in 2012–2013, up from 48 percent in 2011–2012.
We reduced the average turnaround time for investigations (from date registered) by 52 days, from 432 days in 2011–2012 to 380. The median time was 215 days, two months less than in 2011–2012. The median overall turnaround time from the date we assigned a complaint to an investigator was 86 days.
Overall, we closed 1,622 files in 2012–2013, slightly more than we received and 8-percent more than we completed in 2011–2012. This means that for the fourth year in a row we were able to make a dent in our inventory, which we have reduced by 28.6 percent since April 1, 2009. As was true last year, our inventory at year-end (Figure 4) was largely composed of complex refusal files (involving the application of exemptions, for example), since we were able to absorb the increase in administrative complaints nearly completely, due to our having a fully staffed unit to investigate them.
We closed an average of 1,824 files annually from 2009–2010 to 2012–2013.
Figure 1. Summary of caseload, 2009–2010 to 2012–2013
| 2009–2010 | 2010–2011 | 2011–2012 | 2012–2013 | |
|---|---|---|---|---|
| Complaints carried over from the previous year | 2,514 | 2,086 | 1,853 | 1,822 |
| New complaints received | 1,653 | 1,810 | 1,460 | 1,579 |
| New Commissioner-initiated complaints | 36 | 18 | 5 | 17 |
| Total new complaints | 1,689 | 1,828 | 1,465 | 1,596 |
| Complaints discontinued during the year | 575 | 692 | 642 | 400 |
| Complaints settled during the year | n/a | 18 | 34 | 171 |
| Complaints completed during the year with findings | 1,542 | 1,351 | 820 | 1,051 |
| Total complaints closed during the year | 2,117 | 2,061 | 1,496 | 1,622 |
| Total inventory at year-end | 2,086* | 1,853** | 1,822 | 1,796 |
*Includes 127 complaints on hold pending ongoing litigation
**Includes 190 complaints on hold pending ongoing litigation
Figure 2. Trend in complaints registered, 2009–2010 to 2012–2013
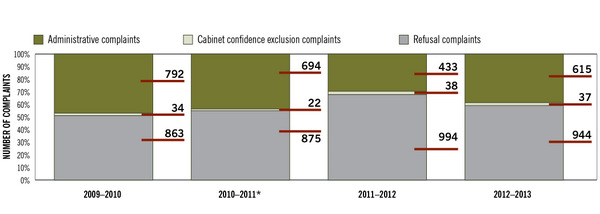
*The 237 delay complaints we received in July 2010 have been removed for comparison purposes.
Text Version
Figure 2
This bar chart shows the number of complaints we registered in each of 2009–2010, 2010–2011, 2011–2012 and 2012–2013 in three categories (from top to bottom): administrative complaints, Cabinet confidence exclusion complaints and refusal complaints.
In 2009–2010, we received 792 administrative complaints, 34 Cabinet confidence exclusion complaints and 863 refusal complaints.
In 2010–2011, we received 694 administrative complaints, 22 Cabinet confidence exclusion complaints and 875 refusal complaints. We received 237 delay complaints (a type of administrative complaint) all at once in July 2010. These have been removed from this chart for comparative purposes.
In 2011–2012, we received 433 administrative complaints, 38 Cabinet confidence exclusion complaints and 994 refusal complaints.
In 2012–2013, we received 615 administrative complaints, 37 Cabinet confidence exclusion complaints and 944 refusal complaints.
Figure 3. Top 15 institutions with administrative complaints, 2010–2011 to 2012–2013
| 2010–2011 | 2011–2012 | 2012–2013 | |
|---|---|---|---|
| Canada Revenue Agency | 295 | 49 | 109 |
| Royal Canadian Mounted Police | 28 | 24 | 76 |
| Foreign Affairs and International Trade Canada | 14 | 21 | 35 |
| Transport Canada | 54 | 14 | 34 |
| Citizenship and Immigration Canada | 43 | 35 | 33 |
| National Defence | 30 | 22 | 31 |
| Privy Council Office | 17 | 5 | 31 |
| Health Canada | 62 | 18 | 25 |
| Canada Border Services Agency | 9 | 12 | 23 |
| Correctional Service of Canada | 47 | 20 | 21 |
| Public Works and Government Services Canada | 60 | 20 | 21 |
| Canadian Food Inspection Agency | 6 | 7 | 19 |
| Environment Canada | 12 | 8 | 14 |
| Department of Justice Canada | 11 | 10 | 11 |
| Treasury Board Secretariat | 6 | 4 | 11 |
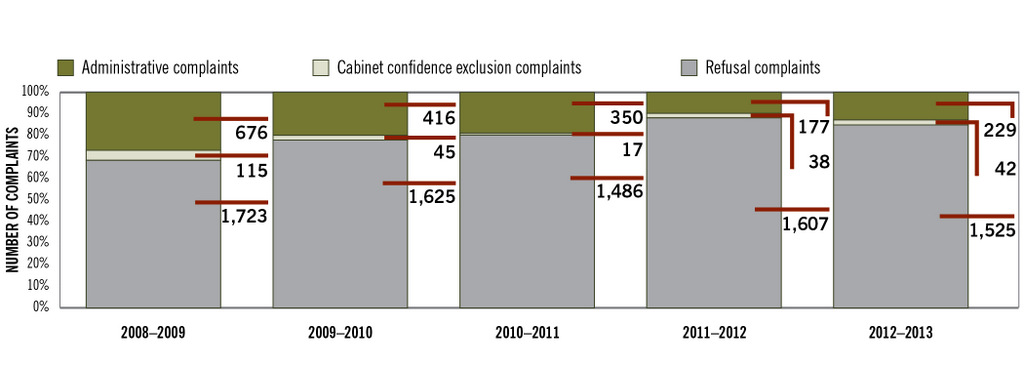
Figure 4. Trend in year-end inventory, 2008–2009 to 2012–2013
Text Version
Figure 4
This bar chart shows the number of complaints we had in our inventory at the end of each of 2008–2009, 2009–2010, 2010–2011, 2011–2012 and 2012–2013 in three categories: administrative complaints, Cabinet confidence exclusion complaints and refusal complaints.
At the end of 2008–2009, we had 676 administrative complaints, 115 Cabinet confidence exclusion complaints and 1,723 refusal complaints in our inventory.
At the end of 2009–2010, we had 416 administrative complaints, 45 Cabinet confidence exclusion complaints and 1,625 refusal complaints in our inventory.
At the end of 2010–2011, we had 350 administrative complaints, 17 Cabinet confidence exclusion complaints and 1,486 refusal complaints in our inventory.
At the end of 2011–2012, we had 177 administrative complaints, 38 Cabinet confidence exclusion complaints and 1,607 refusal complaints in our inventory.
At the end of 2012–2013, we had 229 administrative complaints, 42 Cabinet confidence exclusion complaints and 1,525 refusal complaints in our inventory.
Making significant improvements in turnaround time
In addition to the continued decrease in our inventory, we were able to achieve significant improvement in our turnaround times for the complaints we closed in 2012–2013.
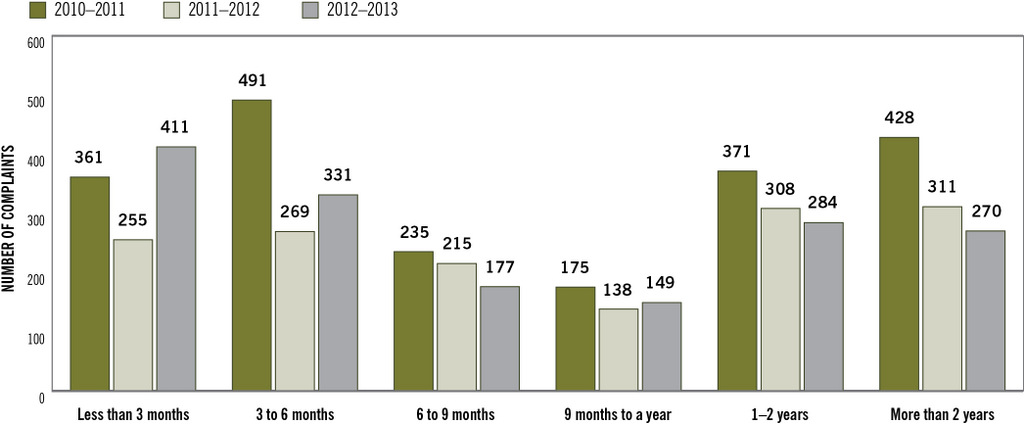
Figure 5: Turnaround times for complaints closed, 2010–2011 to 2012–2013
Text Version
This bar graph shows how long it took us to close complaints in three fiscal years: 2010–2011, 2011–2012 and 2012–2013. There are six time frames represented: less than three months; three to six months; six to nine months; nine months to a year; one to two years; and more than two years.
We closed 361 complaints in less than three months in 2010–2011, 255 in the same time frame in 2011–2012 and 411 in 2012–2013.
We closed 491 complaints in three to six months in 2010–2011, 269 in the same time frame in 2011–2012 and 331 in 2012–2013.
We closed 235 complaints in six to nine months in 2010–2011, 215 in the same time frame in 2011–2012 and 177 in 2012–2013.
We closed 175 complaints in nine months to a year in 2010–2011, 138 in the same time frame in 2011–2012 and 149 in 2012–2013.
We closed 371 complaints in one to two years in 2010–2011, 308 in the same time frame in 2011–2012 and 284 in 2012–2013.
We closed 428 complaints in more than two years in 2010–2011, 311 in the same time frame in 2011–2012 and 270 in 2012–2013.
The first indicator of this is the proportion of all complaints we closed within nine months. In 2012–2013, we closed more complaints within that time frame than we did the year before (57 percent versus 49 percent), measuring from the date we registered the complaints (Figure 5). This improvement held true in terms of both the number of files we closed and the percentage of the total volume of cases we completed.
We also have a goal to close 85 percent of administrative complaints within 90 days. In 2012–2013, we made progress toward this target, closing 70 percent of administrative files in 90 days, compared to 48 percent in 2011–2012 (from date of assignment).
Calculating the average turnaround time for a complaint is another way we measure our performance. This was down in 2012–2013, both overall and within the administrative and refusal complaint categories (from date of registration). We shaved 52 days off the average turnaround time, reducing it from 432 days to 380. Over the same period, the average for administrative complaints was 138 days (compared to 236 the year before; a decrease of nearly 100 days) and 509 days for refusals (down from 565).
Looking at the median turnaround time gives us a good sense of how we are improving the typical service complainants can expect. The median for all files was 215 days, down from 276 in 2011–2012 (from date registered). It was 94 days for administrative files (a drop of roughly two months from the year before) and 350 days for refusals (down from 419 days).
Finally, we calculate how quickly we are completing files from date of assignment. In 2012–2013, the median turnaround time was 86 days, down from 91 in 2011–2012. For administrative files, the time was 52 days, a significant drop from 96 the year before. The median time for refusal files increased, however (140 days versus 89 in 2011–2012), reflecting the complexity and age of some of the cases we closed in 2012–2013.
Comparing the turnaround time from date registered and date assigned serves to emphasize a serious challenge we face, one that is already testing our ability to deliver on our mandate—the challenge of resources. For example, the median for refusal complaints from the date of registration was 350 days in 2012–2013, compared to 140 days from date assigned. The gap of 210 days (about seven months) between the two time periods is largely accounted for by the fact that we are unable to assign refusal complaints (the most complex of our files) to investigators immediately upon receiving them. We simply do not have the staff to do so.
While we continue to strive to maximize our complement of investigators, there is very little more we can do through internal resource reallocation. The only way we can make ongoing gains in productivity of any significance is by receiving more resources to allow us to augment our investigative team.
Targeted strategies to handle our caseload
We began 2012–2013 with an inventory of complaints comprising nearly 90 percent refusal cases. More than half of these refusals (52 percent) were in three categories: files involving sensitive matters of national security, international affairs and defence, and complaints against the Canada Revenue Agency (CRA) and against the Canadian Broadcasting Corporation (CBC). As we did in 2011–2012, we continued to focus on these complaints, refining our approaches and developing new ones to suit the circumstances.
Our approach to the national security, international affairs and defence files was to focus on our backlog of oldest files—58 dating from before April 1, 2009—and other groups of files with common features. Our concerted efforts to mediate between institutions and complainants was key to our closing 163 of these files in 2012–2013, up from 109 the year before. We received good cooperation from institutions, particularly when it came to meeting in person on difficult files to determine what points were still at issue and how to resolve them.
To tackle the volume of complaints against CRA and the CBC, we assigned expert resources to these files to capitalize on their experience and growing familiarity with the people and issues involved. We closed 442 files against these institutions in 2012–2013.
Ongoing dialogue with the community
In recent years, we have sought to improve our communication with institutions. Efforts in this regard have taken place not only in the context of individual files but also between our managers and institutional officials, from the deputy minister to the access to information coordinator. In all instances, our goal has been to facilitate the investigation process by making it clearer and more predictable. This ongoing dialogue has also been helpful when managers have had to step in to resolve particular problems in an investigation.
In January 2013, we took this communication one step further by launching a series of semi-annual meetings with coordinators. With the Commissioner and Assistant Commissioner, Complaints Resolution and Compliance, on hand, as well as other senior officials, these meetings are an excellent opportunity to share information about our investigation process and expectations, and to get feedback from institutions on ways we could improve. In 2013–2014, we will initiate discussions with complainants on similar issues.
Despite these efforts, these three categories of complaint accounted for 46.2 percent of our inventory as of March 31, 2013 (Figure 6), a 6.4 percent decrease over the year. We will continue to target these complaints in 2013–2014.
We also worked closely with the Cabinet confidences group at the Privy Council Office (PCO) to speed up the course of delay complaints that also involved records that may have contained Cabinet confidences. We acted as an intermediary with that group to determine when institutions would get a response to consultations about these requests, since institutions could not at the time directly seek this information, except through their legal counsel, which could be time-consuming.
Figure 6: Complaints in three categories in our inventory, as of March 31, 2013
| Overall inventory | Number (percentage of total complaint inventory) | ||
|---|---|---|---|
| National security, international affairs and defence | Canada Revenue Agency | Canadian Broadcasting Corporation | |
| 1,796 | 335 (18.7%) | 281 (15.6%) | 213 (11.9%) |
Our oldest files
The number of years that have passed since we received some files presents considerable challenges to us as we try to investigate them. The most significant is that very often the players involved—not only our investigators but also the analysts and subject-matter experts at the institutions—have changed, sometimes more than once, over the course of the investigation. This means that we have had to essentially start our work over from scratch in some instances. Another factor is the loss of memory about the details and circumstances of the original request, the issue in question (including the environment in which it was playing out) and the ins and outs of the work done to try to resolve the complaint.
Nonetheless, we have closed just about all our pre-2008 files, including, in early April 2013, the oldest one on our books. We are now concentrating on wrapping up files we received between April 1, 2008, and April 1, 2010.
Settling matters through mediation
In 2012–2013, we made extensive use of mediation to resolve issues that arose during complaint investigations. This is shown clearly in our growing use of the “settled” category for complaints. A settled complaint is one concluded to the satisfaction of all parties involved without the need for us to make a finding (i.e. well founded). Complaints closed as settled increased from 2 percent overall in 2011–2012 to 11 percent in 2012–2013, with a corresponding decrease in discontinued complaints.
See "Other notable statistics," below, for more information on the various outcomes of our complaints.
Taking a more formal approach, when necessary
Although we close 99 percent of complaints each year through mediation, we do invoke the Commissioner’s broad investigative powers on occasion, when we are of the view that continued discussion with access to information officials may not produce any results.
In these instances, we involve increasingly senior officials, including the Assistant Commissioner, in discussions with their counterparts at institutions to resolve outstanding matters. When we continue to be at an impasse, or the Commissioner chooses for another reason to make formal recommendations to address the issue, she may write to the head of the institution (a subsection 37(1) report). These reports serve to raise issues at the highest levels in the organization and give the institution a final opportunity to respond (and, we hope, resolve the matter) before reporting to the complainant. In 2012–2013, the Commissioner issued such a report for 12 complaints.
Using formal mechanisms to advance administrative complaints
We have taken a stricter approach to receiving work plans and proposed release dates from institutions. For example, we give institutions five days to provide us with a work plan for any complaint about a request that is in deemed refusal (that is, overdue according to the legislative deadline). Otherwise, we issue a letter to senior institutional officials formally re-iterating the request.
Similarly, for complaints about lengthy time extensions, we issue a formal letter asking for an earlier date than the extended one on which the institution will provide a response to the requester. Both these approaches have proven effective in speeding up the investigation process and getting requesters an answer more quickly, including more records in some instances.
Other examples of the Commissioner’s formal powers are compelling institutions to produce records and seeking affidavit evidence to forward an investigation. In some cases, we hold formal inquiries to gather evidence, subpoenaing witnesses and documents, as required. If we find evidence of the possible commission of an offence, we may disclose information to the Attorney General of Canada.
When an institution declines to follow our recommendations with regard to a complaint, we may, with the consent of the complainant, choose to seek a judicial review of the matter before the Federal Court. We initiated five such cases in 2012–2013 and intervened in several other matters before the courts.
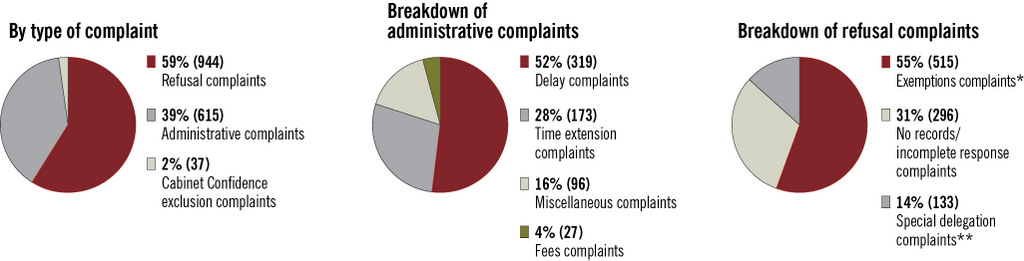
Other notable statistics
Complaints registered, April 1, 2012, to March 31, 2013
*Complaints involving sensitive information concerning national security, international affairs and defence
**Includes section 68, 68.1 and 68.2 exclusions
Text Version
These three pie charts show the proportion of various types of complaint we registered in 2012–2013.
The chart on the left shows the proportion for each of three categories of complaint we registered: Clockwise from the top right, the first section shows 59 percent refusal complaints (944); the next 39 percent administrative complaints (615); and the last 2 percent Cabinet confidence exclusion complaints (37).
The chart in the centre shows the proportions of various types of administrative complaint we registered. Clockwise from the top right, the first section shows 52 percent delay complaints (319); the next 28 percent time extension complaints (173); the next 16 percent miscellaneous complaints (96); and the last 4 percent fees complaints (27).
The chart on the right shows the proportions of various types of refusal complaint we registered. Clockwise from the top right, the first section shows 55 percent exemption complaints (including exclusions under section 68, 68.1 and 68.2 of the Access to Information Act) (515); the next 31 percent no records/incomplete response (296); and the last 14 percent special delegation complaints (those involving sensitive information concerning national security, international affairs and defence) (133).
Of the 1,596 complaints we received in 2012–2013, 39 percent were about administrative matters, while 59 percent were refusal files (with the standard 2 percent of complaints about Cabinet confidence exclusions). The proportion of administrative to refusal complaints has changed somewhat from 2011–2012, when it was 30:68.
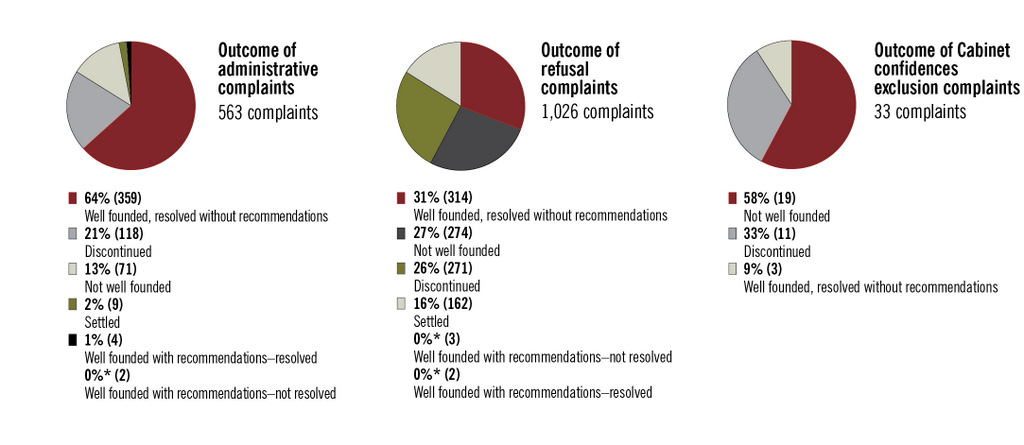
Outcome by type of complaint, for complaints closed between April 1, 2012, and March 31, 2013
*Percentages are rounded to the nearest whole number.
Text Version
These three pie charts show the results of our investigations for three categories of complaint.
The chart on the left sets out the outcomes for 563 administrative complaints. Clockwise from the top right, the first section shows the 64 percent of complaints (359) that were well founded, resolved without recommendations. The second section shows the 21 percent (118 complaints) that were discontinued. This is followed by four sections, as follows: 13 percent (71 complaints) that were not well founded; 2 percent (9 complaints) settled; 1 percent (4 complaints) well founded with recommendations—resolved; and 0 percent (2 complaints) well founded with recommendations—not resolved. The percentages in this graph are rounded to the nearest whole number.
The chart in the centre sets out the outcomes for 1,026 refusal complaints. Clockwise from the top right, the first section shows the 31 percent (314 complaints) of complaints that were well founded, resolved without recommendations. The second section shows the 27 percent (274) that were not well founded. Next is the 26 percent (271 complaints) that were discontinued. This is followed by three sections, as follows: 16 percent (162 complaints) settled; 0 percent (3 complaints) well founded, with recommendations–not resolved; and 0 percent (2 complaints) well founded with recommendations—resolved. The percentages in this graph are rounded to the nearest whole number.
The chart on the left sets out the outcomes for 33 Cabinet confidence exclusion complaints. Clockwise from the top right, the first section shows the 58 percent of complaints (19 complaints) that were not well founded. The second section shows the 33 percent (11) that were discontinued. The third section shows 9 percent (3 complaints) that were well founded, resolved without recommendations. The percentages in this graph are rounded to the nearest whole number.
Figure 2
Overall, there was a shift in the ratio of complaints with findings to complaints discontinued: 75:25 in 2012-2013 compared to 45:55 in 2011-2012 and very similar to the more traditional 70:30 ratio seen in previous years. This is due to our increased use of the settled category for complaints, particularly for refusals (16 percent of outcomes versus 2 percent in 2011–2012). Another notable change was in the percentage of administrative complaints that were well founded and resolved without recommendations (64 percent in 2012–2013 compared to 55 percent the year before). The outcome of Cabinet confidence exclusion complaints was also different this year compared to last: 58 percent were not well founded (38 percent in 2011–2012) and 9 percent were well founded and resolved without recommendations (19 percent in 2011–2012).
New complaints in 2012–2013, top 15 institutions*
| Canada Revenue Agency | 336 |
|---|---|
| Royal Canadian Mounted Police | 125 |
| Citizenship and Immigration Canada | 109 |
| Foreign Affairs and International Trade Canada | 83 |
| National Defence | 72 |
| Transport Canada | 72 |
| Canada Border Services Agency | 63 |
| Correctional Service of Canada | 57 |
| Privy Council Office | 52 |
| Aboriginal Affairs and Northern Development Canada | 45 |
| Canadian Broadcasting Corporation | 45 |
| Health Canada | 37 |
| Industry Canada | 36 |
| Public Works and Government Services Canada | 35 |
| Canadian Food Inspection Agency | 26 |
| Others (74 institutions) | 403 |
| Total | 1,596 |
*Includes 17 Commissioner-initiated complaints
The number of institutions about which we received complaints in 2012–2013 increased to 89, from 88 the year before. Notable changes among the top 15 institutions involve the RCMP, which jumped from fourth to second place, and the CBC, which dropped from third place to tied for tenth. Canada Post and the Department of Justice Canada are no longer among the top 15 while Transport Canada and the Canadian Food Inspection Agency joined the list. The Canada Revenue Agency remains far and away the most complained about institution, while the RCMP’s complaints grew by 84 percent.
Complaints completed with findings in 2012–2013, by institution*
| Overall | With merit | Not well founded | |
|---|---|---|---|
| Canada Revenue Agency | 179 | 146 | 33 |
| Citizenship and Immigration Canada | 96 | 50 | 46 |
| Royal Canadian Mounted Police | 69 | 57 | 12 |
| Correctional Service of Canada | 65 | 41 | 24 |
| Foreign Affairs and International Trade Canada | 59 | 34 | 25 |
| Canadian Broadcasting Corporation | 56 | 40 | 16 |
| National Defence | 47 | 21 | 26 |
| Health Canada | 38 | 31 | 7 |
| Public Works and Government Services Canada | 32 | 16 | 16 |
| Transport Canada | 27 | 22 | 5 |
| Aboriginal Affairs and Northern Development Canada | 26 | 16 | 10 |
| Privy Council Office | 23 | 14 | 9 |
| Department of Justice Canada | 22 | 13 | 9 |
| Environment Canada | 21 | 13 | 8 |
| Canada Border Services Agency | 20 | 14 | 6 |
| Others (57 institutions) | 272 | 159 | 113 |
| Total | 1,051 | 687 | 364 |
*Includes five Commissioner-initiated complaints
This chart lists the outcomes of complaints for the 15 institutions for which we issued the most findings in 2012–2013. With the exception of National Defence, all institutions had more complaints closed with merit than they did complaints that were not well founded.