2014-2015 Privy Council Office
Overall performanceFootnote 1
The Privy Council Office (PCO) observed a 28.8% decrease in the number of requests received in 2014-2015. The percentage of requests completed within 30 days decreased by 11.4%. This report provides comparative statistics for the last three periods (2012-2015).
Workload
PCO received 646 requests under the Access to Information Act (the Act), representing slightly less than 1.0% of total requests received across government in 2014-2015. In 2013-2014, PCO received 907 requests which represents a decrease of 28.8% in the number of requests received compared to this reporting period. The majority of requests received in 2014-2015 were from the media (71.2%), followed by the public (17.3%).
PCO completed 677 requests in 2014-2015, which corresponds to a completion rateFootnote 2 of 73.0%, the same as in the previous period. However, PCO’s completion rate is below the government-wide rate of 85.1% for 2014-2015. PCO also received 427 informal requests in 2014-2015 and 33.3% of these were completed within 30 days. The number of consultations received by PCO from other federal government institutions decreased from 431 to 381, representing a decrease of 12.1% compared to 2013-2014.
In 2014-2015, 76,372 pages were processed compared to 58,409 in 2013-2014. The average number of pages processed per completed request also increased from 101 in 2013-2014 to 141 this reporting period.
The information released by PCO was mostly in paper format: 420 in paper format and 1 in electronic format.
Table 1. Workload
| Measures | 2012-2013 | 2013-2014 | 2014-2015 |
|---|---|---|---|
| Number of requests received | 780 | 907 | 646 |
| Annual change (%) | - | 16.3% | -28.8% |
| Completed requests | 725 | 772 | 677 |
| Annual change | - | 6.5% | -12.3% |
| Number of consultations received (from other government institutions) | 511 | 422 | 371 |
| Annual change (%) | - | -17.4% | -12.1% |
| Average number of pages processed per request completed | 78 | 101 | 141 |
| % of requests for which more than 1,000 pages were processed | 1.1% | 1.6% | 2.0% |
Request completion time
Timeliness
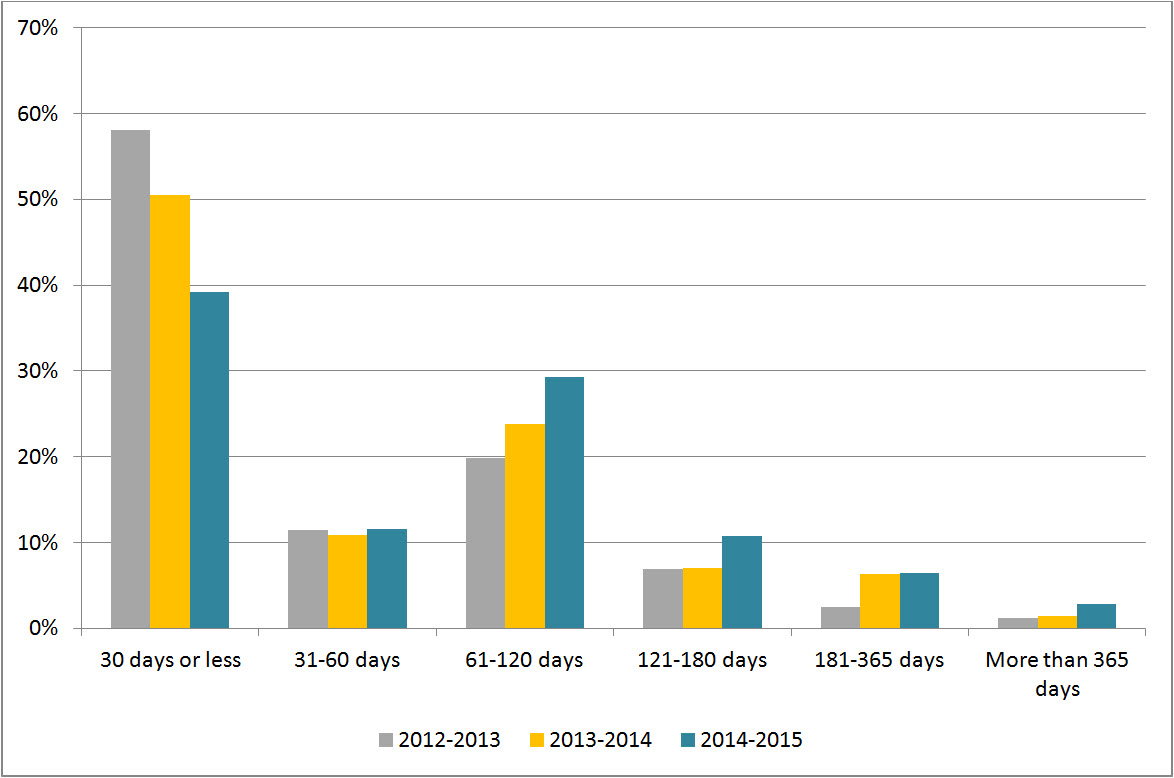
Figure 1 reveals that 39.1% of requests were completed within 30 days or less, which is a decrease of 11.4% compared to 2013-2014. There was also a percentage increase for requests completed in all other categories.
Figure 1: Request Completion Time
Text version
Figure 1 is a bar chart with vertical bars, representing the completion time by PCO during each reporting period between 2012-2013 and 2014-2015. The results are as follows:
| Completion time | 2012-2013 | 2013-2014 | 2014-2015 |
|---|---|---|---|
| 30 days or less | 58.07% | 50.52% | 39.14% |
| 31-60 days | 11.45% | 10.88% | 11.52% |
| 61-120 days | 19.86% | 23.88% | 29.25% |
| 121-180 days | 6.90% | 6.99% | 10.78% |
| 181-365 days | 2.48% | 6.35% | 6.50% |
| More than 365 days | 1.24% | 1.42% | 2.81% |
Extensions
PCO took a total of 459 extensions in 2014-2015 compared to 432 in 2013-2014. The most common reason for taking an extension was interference with operations (66.9%), followed by consultations (26.4%).
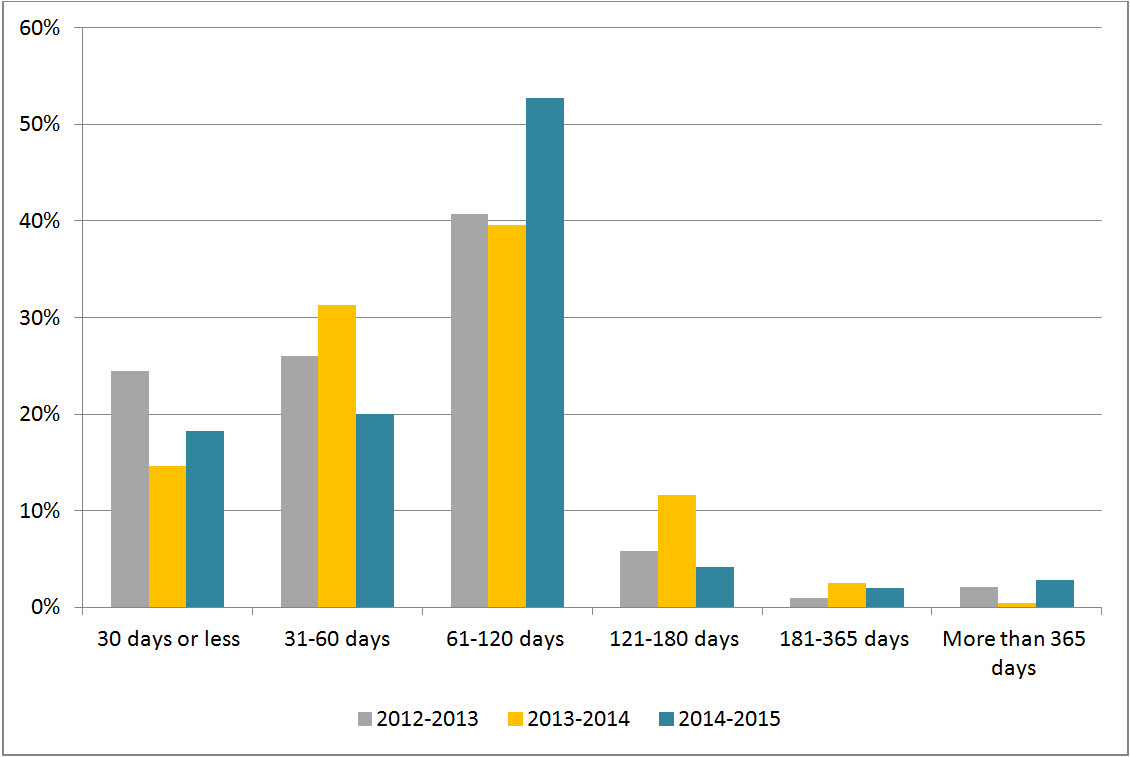
Figure 2 shows that 18.3% of extensions were taken for less than 30 days, which is a slight increase of 3.7% compared to the previous period. The figure also reveals that the number of extensions taken between 31 and 60 days decreased by 11.2% from 2013-2014. Further, 52.7% of extensions were taken between 61 and 120 days, representing a 13.1% increase compared to the previous period.
Figure 2: Length of Extensions
Text version
Figure 2 is a bar chart with vertical bars, representing the length of extensions taken by PCO during each reporting period between 2012-2013 and 2014-2015. The results are as follows:
| Length of extensions | 2012-2013 | 2013-2014 | 2014-2015 |
|---|---|---|---|
| 30 days or less | 24.46% | 14.58% | 18.30% |
| 31-60 days | 25.99% | 31.25% | 20.04% |
| 61-120 days | 40.67% | 39.58% | 52.72% |
| 121-180 days | 5.81% | 11.57% | 4.14% |
| 181-365 days | 0.92% | 2.55% | 1.96% |
| More than 365 days | 2.14% | 0.46% | 2.83% |
Deemed refusals
In 2014-2015, the number of requests closed past the statutory deadline was 32, which accounts for 4.7% of completed requests. This rate represents an “A” grade.Footnotee 3 However, the number of overdue requests doubled compared to the previous period. The most common reason for overdue requests in 2014-2015 was internal consultations (46.9%) and workload (43.8%).
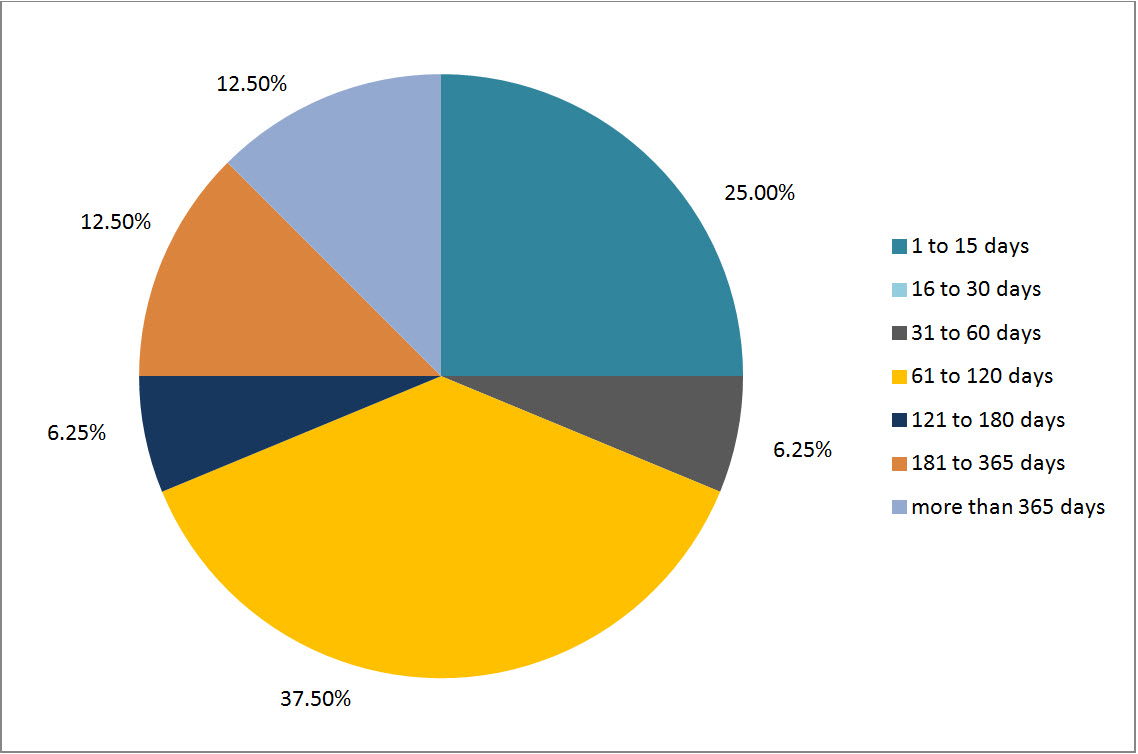
Figure 3 shows that 25.0% of overdue requests were late for 30 days or less corresponding to 8 requests (the same as in the last period). However, most of the overdue requests in 2014-2015 were late between 61 and 120 days (12 requests).
Figure 3: Lateness of Overdue Requests
Text version
Figure 3 is a pie chart, representing the delayed days for overdue requests taken by PCO during in 2014-2015. The results are as follows:
| Number of days | 2014-2015 |
|---|---|
| 1 to 15 days | 25.00% |
| 16 to 30 days | 0.00% |
| 31 to 60 days | 6.25% |
| 61 to 120 days | 37.50% |
| 121 to 180 days | 6.25% |
| 181 to 365 days | 12.50% |
| More than 365 days | 12.50% |
| Total | 100.0% |
Disclosure
Percentage of requests for which information was disclosed
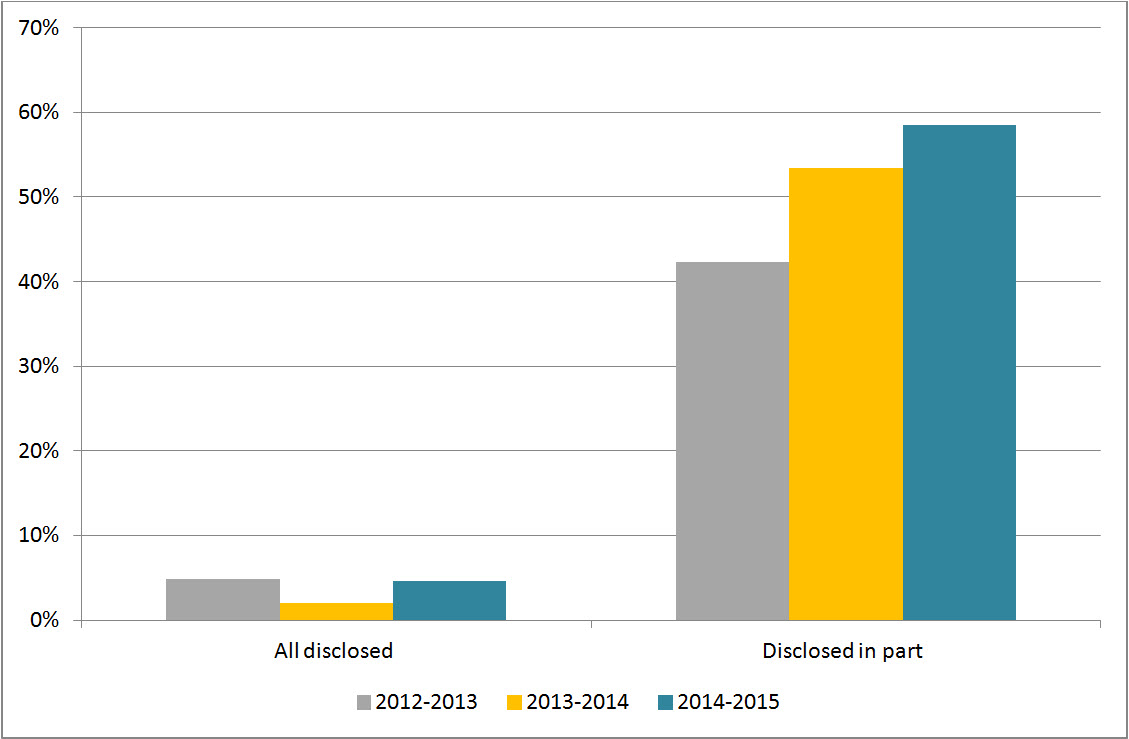
In 2014-2015, 4.6% of completed requests were entirely disclosed which is almost twice the amount as the previous period (see Figure 4). Figure 4 also shows that the rate for partially disclosed requests in 2014-2015 was 58.5%, which represents an increase of 5.1% from 2013-2014.
Figure 4: Level of Disclosure
Text version
Figure 4 is a bar-chart with vertical bars, representing the entirely disclosed and disclosed in part requests as proportion of total requests completed by PCO during each reporting period between 2012-2013 and 2014-2015. The results are as follows:
| Disclosure | 2012-2013 | 2013-2014 | 2014-2015 |
|---|---|---|---|
| All disclosed | 4.83% | 2.07% | 4.58% |
| Disclosed in part | 42.34% | 53.37% | 58.49% |
Exemptions
In total, PCO applied 1,502 exemptions in 2014-2015 compared to 1,226 the previous year. The number of exemptions used per completed request increased from the previous period, increasing from 1.59 in 2013-2014 to 2.22 in 2014-2015 (see Table 2).
The most common exemptions in 2014-2015 were section 21 (Operations of Government) (35.9%) and section 19 (Personal Information) (22.8%), followed by section 15 (International Affairs and Defence) (9.7%).
Table 2: Exemptions
| Exemptions | 2012-2013 | 2013-2014 | 2014-2015 |
|---|---|---|---|
| Total number of exemptions | 835 | 1,226 | 1,502 |
| Total number of completed requests | 725 | 772 | 677 |
| Average number of exemptions per completed request | 1.15 | 1.59 | 2.22 |
Complaints at the OIC
The number of complaints received against PCO was 35Footnote 4 which is similar to the previous period where they received 33. The proportion of administrative complaints was 35.1% in this reporting period, which is a slight increase compared to the previous period of 31.2%.
Around 31% of complaints were well-founded and resolved which is slightly lower than the 39.5% observed in 2013-2014. In addition, 29.6% of complaints were discontinued and 37% were pending.
Footnotes
- Footnote 1
-
Overall performance is based on two primary indicators: % of requests completed within 30 days and % of requests that were fully disclosed.
- Footnote 2
-
The completion rate was calculated using the number of received requests during the reporting period as well as outstanding requests from the previous period.
- Footnote 3
-
The 2007-2008 OIC report card grading system was used to estimate the grade A= 0 to 5%; B= 5 to 10%; C=10 to 15%, D= 15 to 20%, F=20% and more.
- Footnote 4
-
The numbers reported in this section are based on the OIC’s statistics. The information may not reflect the statistics reported by institutions due to the discrepancies in the methodology used.