2014-2015 Appendix A: Facts and figures
Complaints registered, 2010–2011 to 2014–2015
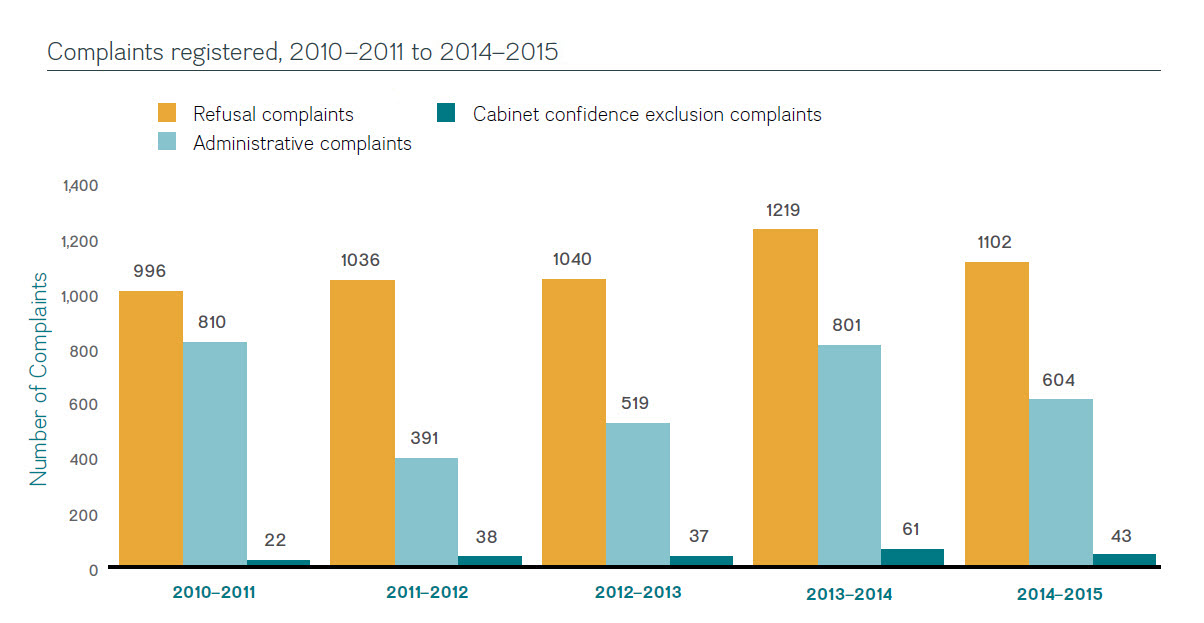
Note: As of April 1, 2013, the Commissioner counts all miscellaneous complaints as refusal complaints. Previously, they had been classified as administrative complaints.
Text Version
The figure is a vertical bar chart showing the number of complaints that the Commissioner registered for the years 2010–2011 to 2014–2015. There are three categories each year: refusal complaints, administrative complaints and complaints related to Cabinet Confidences exclusions.
In 2010–2011, the Commissioner received 996 refusal complaints, 810 administrative complaints and 22 Cabinet Confidences complaints.
In 2011–2012, the Commissioner received 1,036 refusal complaints, 391 administrative complaints and 38 Cabinet Confidences complaints.
In 2012–2013, the Commissioner received 1,040 refusal complaints, 519 administrative complaints and 37 Cabinet confidences complaints.
In 2013–2014, the Commissioner received 1,219 refusal complaints, 801 administrative complaints and 61 Cabinet confidences complaints.
In 2014–2015, the Commissioner received 1,102 refusal complaints, 604 administrative complaints and 43 Cabinet confidences complaints.
In 2014–2015 the Commissioner received 604 administrative complaints (about delays, time extensions and fees), 43 Cabinet confidence refusal complaints and 1,102 refusal complaints (about the application of exemptions).
The ratio of administrative complaints to refusal complaints registered was 35:65.
New complaints by institution, 2010–2011 to 2014–2015Footnote 1
| 2010–2011 | 2011–2012 | 2012–2013 | 2013–2014 | 2014–2015 | |
|---|---|---|---|---|---|
Citizenship and Immigration Canada |
84 |
66 |
109 |
305 |
246 |
Canada Revenue Agency |
502 |
324 |
336 |
283 |
221 |
Royal Canadian Mounted Police |
69 |
68 |
125 |
185 |
178 |
National Defence |
68 |
74 |
72 |
119 |
118 |
Transport Canada |
77 |
30 |
72 |
83 |
87 |
Foreign Affairs, Trade and Development Canada |
31 |
56 |
83 |
120 |
83 |
Canada Border Services Agency |
29 |
36 |
63 |
106 |
78 |
Health Canada |
81 |
49 |
37 |
48 |
65 |
Privy Council Office |
57 |
36 |
52 |
48 |
54 |
VIA Rail Canada Inc. |
2 |
7 |
7 |
2 |
54 |
Department of Justice Canada |
30 |
47 |
24 |
51 |
44 |
Canadian Broadcasting Corporation |
183 |
71 |
45 |
61 |
37 |
Natural Resources Canada |
5 |
12 |
21 |
38 |
35 |
Correctional Service Canada |
82 |
65 |
57 |
56 |
33 |
Employment and Social Development Canada |
26 |
25 |
20 |
37 |
33 |
Canada Post Corporation |
41 |
46 |
8 |
10 |
30 |
Canadian Security Intelligence Service |
22 |
8 |
15 |
20 |
27 |
Environment Canada |
15 |
17 |
26 |
29 |
26 |
Public Works and Government Services Canada |
88 |
45 |
35 |
28 |
26 |
Public Safety Canada |
21 |
6 |
5 |
14 |
25 |
The chart above shows the 20 institutions that received the most complaints in 2014–2015. Many institutions appear on this list from year to year. For example, 2014–2015’s top three (Citizenship and Immigration Canada, Canada Revenue Agency and Royal Canadian Mounted Police) were the same as in 2013–2014, although all three institutions received fewer complaints. Two institutions made their first appearance on the list in five years: VIA Rail Canada Inc. (due to its receiving a large number of complaints from one individual) and Public Safety Canada.
Turnaround times for complaint investigations, 2010–2011 to 2014–2015
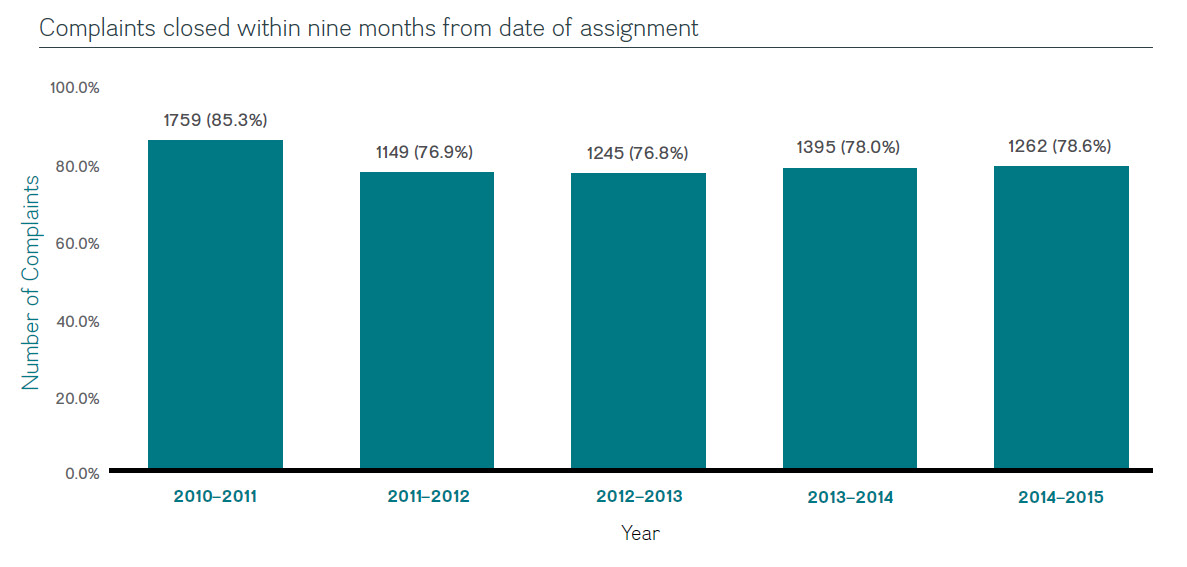
Complaints closed within nine months from date of assignment
Text Version
This bar chart shows the proportion of complaints that the Commissioner has closed within nine months after the date on which they were assigned to an investigator in fiscal years 2010–2011 to 2014–2015.
In 2010–2011, 85.3% of complaints were resolved within nine months (1,759 complaints).
In 2011–2012, 76.9% of complaints were resolved within nine months (1,149 complaints).
In 2012–2013, 76.8% of complaints were resolved within nine months (1,245 complaints).
In 2013–2014, 78.0% of complaints were resolved within nine months (1,395 complaints).
In 2014–2015, 78.6% of complaints were resolved within nine months (1,262 complaints).
In 2014–2015, the Commissioner closed more than three-quarters (79 percent) of complaints within nine months of being assigned to an investigator. However, given a shortage of staff, there is a gap of about five months (142 days) before a file can be assigned.
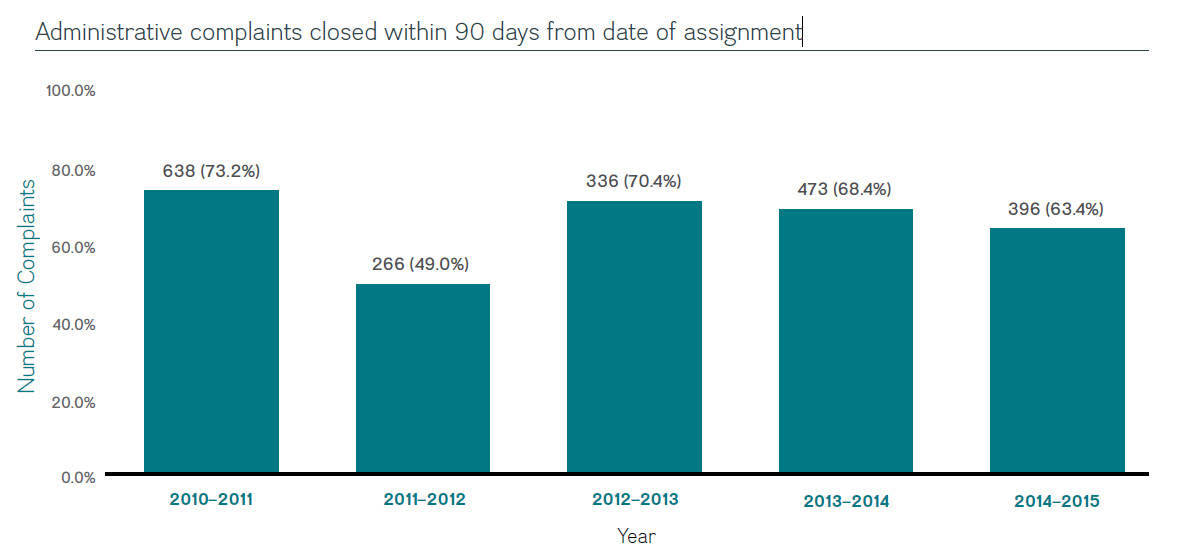
Administrative complaints closed within 90 days from date of assignment
Text Version
This vertical bar chart shows the proportion of administrative complaints that the Commissioner closed within 90 days after the date on which they were assigned to an investigator during the years 2010–11 to 2014–2015.
In 2010–2011, 73.2% of administrative complaints were resolved within 90 days (638 complaints).
In 2011–2012, 49.0% of administrative complaints were resolved within 90 days (266 complaints).
In 2012–2013, 70.4% of administrative complaints were resolved within 90 days (336 complaints).
In 2013–2014, 68.4% of administrative complaints were resolved within 90 days (473 complaints).
In 2014–2015, 63.4% of administrative complaints were resolved within 90 days (396 complaints).
The Commissioner’s performance objective is to close 85 percent of administrative complaints within 90 days of their being assigned to an investigator. This rate is not always achievable, in part because of the difficulty in obtaining commitment dates and work plans from some institutions. In light of the Federal Court of Appeal’s March 2015 decision in Information Commissioner of Canada v. Minister of National Defence, 2015 FCA 56, the Commissioner will be taking a more stringent approach to the use of extensions. The Commissioner will issue an advisory notice in 2015–2016 on how she will implement the Court of Appeal’s decision when conducting investigations.
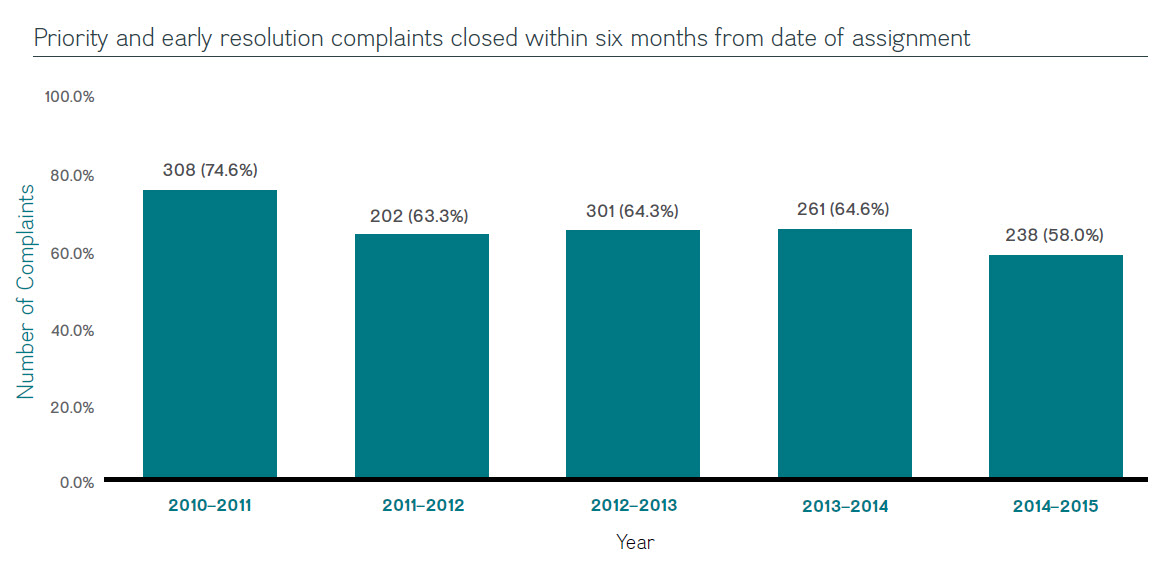
Priority and early resolution complaints closed within six months from date of assignment
Text Version
This vertical bar chart shows the proportion of priority and early resolutions complaints that were closed within six months from their date of assignment during the years 2010–2011 to 2014–2015.
In 2010–2011, 74.6% of administrative complaints were resolved within six months (308 complaints).
In 2011–2012, 63.3% of administrative complaints were resolved within six months (202 complaints).
In 2012–2013, 64.3% of administrative complaints were resolved within six months (301 complaints).
In 2013–2014, 64.6% of administrative complaints were resolved within six months (261 complaints).
In 2014–2015, 58.0% of administrative complaints were resolved within six months (238 complaints).
The Commissioner’s performance objective is to close 75 percent of her priority and early resolution cases (refusal investigations) within six months from the date they are assigned to an investigator. In 2014–2015, she closed 58 percent of these files in this time frame. This difference from the previous year was due, in part, to a number of more complex investigations (as described in Chapter 1) that required the dedicated attention of a number of investigators.
Complaints closed in 2014–2015
| Overall | Well-founded | Not well-founded | Settled | Discontinued | |
|---|---|---|---|---|---|
Citizenship and Immigration Canada |
285 |
156 |
39 |
60 |
30 |
Royal Canadian Mounted Police |
148 |
54 |
32 |
12 |
50 |
Canada Border Services Agency |
110 |
34 |
10 |
52 |
14 |
National Defence |
110 |
32 |
20 |
35 |
23 |
Canada Revenue Agency |
104 |
65 |
8 |
6 |
25 |
Foreign Affairs, Trade and Development Canada |
71 |
20 |
1 |
24 |
26 |
Transport Canada |
61 |
30 |
16 |
0 |
15 |
Correctional Service Canada |
53 |
16 |
11 |
2 |
24 |
Privy Council Office |
52 |
17 |
2 |
9 |
24 |
Canadian Broadcasting Corporation |
41 |
14 |
15 |
9 |
3 |
VIA Rail Canada Inc. |
40 |
1 |
36 |
3 |
0 |
Health Canada |
38 |
20 |
7 |
4 |
7 |
Employment and Social Development Canada |
37 |
21 |
2 |
3 |
11 |
Aboriginal Affairs and Northern Development Canada |
33 |
19 |
1 |
5 |
8 |
Department of Justice Canada |
33 |
4 |
4 |
13 |
12 |
Industry Canada |
32 |
7 |
1 |
2 |
22 |
Natural Resources Canada |
30 |
19 |
3 |
1 |
7 |
Environment Canada |
30 |
10 |
3 |
9 |
8 |
Public Works and Government Services Canada |
26 |
10 |
8 |
2 |
6 |
Public Safety Canada |
20 |
6 |
7 |
1 |
6 |
Others (61 institutions) |
251 |
88 |
44 |
24 |
95 |
TotalFootnote 2 |
1,605 |
643 |
270 |
276 |
416 |
This chart lists the 20 institutions about which the Commissioner completed the most complaints in 2014–2015.
Footnotes
- Footnote 1
-
Institutions are listed by the number of complaints the Commissioner received about them in 2014–2015. The figures for each year include any complaints initiated by the Commissioner under subsection 30(3) of the Access to Information Act (11 in 2014–2015).
This chart contains real numbers only and does not reflect the proportion of complaints as compared to the number of requests.
- Footnote 2
-
The total number of complaints closed includes any that had been initiated by the Commissioner under subsection 30(3) of the Access to Information Act (15 in 2014–2015).