2013-2014 Treasury Board of Canada Secretariat
Treasury Board Secretariat (TBS) has a dual mandate that includes supporting the Treasury Board as a committee of ministers, in addition to fulfilling the statutory responsibilities of a central government agency.
In 2013–2014, TBS received 578 requests,Footnote 1 which represents a significant increase compared to 2012–2013 (301 requests, increase of 92%). It received 34% less requests from other government institutions. The performance of TBS was stronger in 2013–2014 than in 2012–2013 in terms of timeliness.
TBS completed about 563 of all the 638 requests in its inventory in 2013–2014, a completion rate of 88.2%. This is 2% higher than in 2012–2013.
More than half of the requests received in 2013–2014 came from the public (59.9% compared to 52.5% in 2012–2013). Members of the media also accounted for 25.6% (compared to 23.6% in 2012–2013).
An additional 159 informal requests that were not captured in the statistics were processed in 2013–2014, compared to 97 in 2012–2013.
Table 1. Workload
| Measures | Reporting Period 2012–2013 |
Reporting Period 2013–2014 |
Difference |
|---|---|---|---|
| Number of requests received | 301 | 578 | 92.03% |
| Number of consultations received (from other government institutions) | 262 | 173 | -33.97% |
| Average number of pages processed per request completed | 471 | 241 | -230 |
| % of requests for which more than 1,000 pages were processed | 11.11% | 4.33% | -6.78% |
| Note: The average number of pages processed per request completed and the percentage of requests for which more than 1,000 pages were processed are calculated from the total of requests completed for which the information was disclosed (in part or totally), exempted/excluded and for requests abandoned. It excludes requests completed for the following dispositions: no records exist, requests transferred and requests treated informally. | |||
Despite completing more requests in 2013–2014, the overall volume of pages processed decreased by 30% compared to the previous reporting period. Furthermore, the number of pages processed per request completed in 2013–2014 decreased almost by half (241 pages compared to 471 in 2012–2013).
TBS reported that the decrease in the total volume of pages processed is due to proactive posting of frequently sought information and completed access to information summaries on the government’s Open Data Portal, proactive negotiation with the requestors to target what information is sought, and a larger number of requests for information that was either outside of the Secretariat’s mandate or for which the Secretariat had no records.
Timeliness
TBS responded to 413 requests within 30 days, which represents about 73.4% of the requests completed in 2013–2014. This is a significant improvement compared to 2012–2013 (63.3%).
The number of requests completed past 120 days went down significantly in 2013–2014 (10.3% compared to 24.1% in 2012–2013). This is also similar to the result achieved government-wide (10.6 % in 2013–2014).
Requests closed past the statutory or extended deadline represented 2.3% of all requests completed in 2013–2014 (13 requests). This proportion represents an “A” grade.Footnote 2 In comparison, 16 requests were closed past the statutory or extended deadline in 2011–2012 (representing 4.9% of requests completed).
“Internal consultations” was identified as the principal reason why requests were late in 2013–2014 (6 requests), followed by workload (4 requests).
Extensions
TBS used a total of 131 extensions to complete the 563 requests completed in 2013–2014, a ratio of 0.23 extension per request completed. This ratio was of 0.35 in 2012–2013.
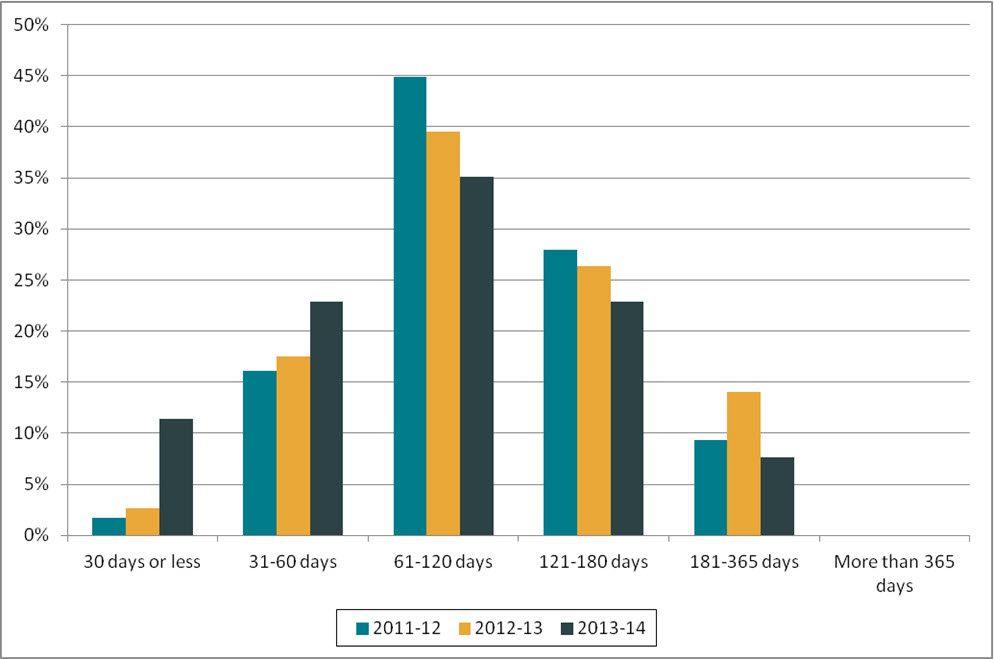
Extensions taken in 2013–2014 tended to be for shorter period of time. The proportion of extensions of 30 days or less increased from 2.6% in 2012–2013 to 11.5% in 2013–2014. Additionally, the proportion of extensions for more than 120 days went down by 10% during that same period.
Figure 1. Length of extensions (2011–2012 to 2013–2014)
Text version
Figure 1 is a bar chart with vertical bars, representing the length of extensions taken by TBS during each reporting period between 2011–2012 and 2013–2014. The results are as follows:
| Reporting period | 30 days or less | 31-60 days | 61-120 days | 121-180 days | 181-365 days | More than 365 days |
|---|---|---|---|---|---|---|
| 2011–2012 | 1.69% | 16.10% | 44.92% | 27.97% | 9.32% | 0.00% |
| 2012–2013 | 2.63% | 17.54% | 39.47% | 26.32% | 14.04% | 0.00% |
| 2013–2014 | 11.45% | 22.90% | 35.11% | 22.90% | 7.63% | 0.00% |
Finally, most of the extensions (82.4%) were taken for consultations under section 9(1)(b) in 2013–2014 (proportion similar to 2012–2013). While no extensions were taken under section 9(1)(a) in the past two reporting periods, 7 of them were invoked in 2013–2014.
Disclosure
Of the 563 requests completed, about 10.5% of them were disclosed entirely in 2013–2014, which represents a decrease of 1.3% compared to the reporting period 2012–2013.
The proportion of pages processed that were disclosed in 2013–2014 also went down: while about 70% of them were disclosed in 2012–2013, this proportion dropped to 48% in 2013–2014.
The proportion of requests for which no records existed represented more than half (55.8%) of requests completed by TBS in 2013–2014. It is also significantly above the proportion government-wide (10.5% in 2013–2014). It also transferred 17 requests.
Exemptions/Exclusions
In 2013–2014, a total of 442 exemptions and 142 exclusions were applied by TBS, representing a ratio of 1.04 exemptions/exclusions per request completed. In 2012–2013, this ratio was significantly higher (1.41).
The top 3 most applied exemptions in 2013–2014 were: operations of government (208 times), personal information (67 times) and third-party information (41 times).
Table 2. Performance
| Measures | Reporting Period 2012–2013 |
Reporting Period 2013–2014 |
Difference | |
|---|---|---|---|---|
| Completion of Requests | ||||
| Completion rate | 84.38% | 88.24% | 3.86% | |
| Completion Time | ||||
| % of requests completed within 30 days | 63.27% | 73.36% | 10.09% | |
| Average number of days to complete a request | 71 | N/A | N/A | |
| % of requests closed past statutory or extended deadline | 4.94% | 2.31% | -2.63% | |
| % of consultations from government institution completed within 30 days | 67.15% | 89.29% | 22.14% | |
| % of extensions of 30 days or less | 2.63% | 11.45% | 8.82% | |
| Level of Disclosure | ||||
| % of pages processed that were disclosed | 70.35% | 48.02% | -22.33% | |
| % of requests completed for which the information was disclosed entirely | 11.73% | 10.48% | -1.25% | |
| % of pages disclosed entirely | 31.85% | 15.52% | -16.33% | |
| Exemptions/Exclusions | ||||
| Number of exemptions/exclusions per request completed | 1.41 | 1.04 | -0.37 | |
Other activities
TBS delivered 13 training sessions to its employees (228 staffs) in 2013–2014. This is similar to the last reporting period.
Complaints
The number of complaints received against TBSFootnote 3 in 2013–2014 (21 complaints) went down by 1 complaints compared to 2012–2013.
While most complaints received in 2012–2013 were for refusal (16 complaints), the majority those received in 2013–2014 were related to administrative matters (13 complaints).
As of April 2015, 5 of the complaints received in 2013–2014 were still pending. Of the ones completed, 6 were well founded, 7 were settled, 1 was not well-founded and 1 was discontinued.
Footnotes
- Footnote 1
-
It is reported in the Annual Report that many requests were about leave usage, collective bargaining and disability issues.
- Footnote 2
-
The 2007–2008 OIC report card grading system was used to estimate the grade: A=0 to 5%, B=5 to 10%, C=10 to 15%, D=15 to 20%, F=more than 20%.
- Footnote 3
-
The numbers reported in this section are based on the OIC’s statistics. The information may not reflect the statistics reported by institutions due to the discrepancies in the methodology used.