2013-2014 Transport Canada
Transport Canada (TC) is responsible for transportation policies and programs. It ensures that air, marine, road and rail transportation are safe, secure, efficient and environmentally responsible. Transport Canada works with other government departments and jurisdictions, and with industry to ensure that all parts of Canada’s transportation system work well.
In 2013–2014, TC received 1,091 new requests within the reporting period, a decrease of 50.3%Footnote 1 as compared to 2012–2013 (2,197 requests). However, at the same time, it reported receiving a large number of requests following the Lac-Mégantic rail accident on July 6, 2013. TC was among the top ten institutions in terms of requests received under the Act in 2013–2014, representing 1.8% of all requests.
TC’s results were in general below the ones achieved government-wide in 2013–2014. Requests took longer to complete in 2013–2014 than in the previous year. An extensive use of long extensions in 2013–2014 was observed (the highest among the 27 institutions reviewed).Footnote 2
TC completed 82.6% of all requests in its inventory in 2013–2014, compared to a completion rate of 56.7% achieved in 2012–2013.
The most common sources of requests received in 2013–2014 included members of the media (43.3%), the private sector (28.2%) and the public (18.2%). Members of the public represented 29% of requesters in 2012–2013.
Table 1. Workload
| Measures | Reporting Period 2012–2013 |
Reporting Period 2013–2014 |
Difference |
|---|---|---|---|
| Number of requests received | 2,197 | 1,091 | -50.3% |
| Number of consultations received (from other government institutions) | 265 | 265 | 0 |
| Average number of pages processed per request completed | 104 | 159 | 55 |
| % of requests for which more than 1,000 pages were processed | 2.20% | 2.38% | 0.63% |
| Note: The average number of pages processed per request completed and the percentage of requests for which more than 1,000 pages were processed are calculated from the total of requests completed for which the information was disclosed (in part or totally), exempted/excluded and for requests abandoned. It excludes requests completed for the following dispositions: no records exist, requests transferred and requests treated informally. | |||
Overall, the volume of pages for requests in 2013–2014 was higher than in 2012–2013. While most of the requests required the processing of 100 pages or less (73.8%), the average number of pages processed per request went up from 104 in 2012–2013 to 159 in 2013–2014. The percentage of requests for which more than 1,000 pages were processed remained similar to last year’s number.
Timeliness
TC responded to 441 requests within 30 days or less, which represents about 24.6% of the requests completed in 2013–2014. This proportion was 61% government-wide. A fair amount of requests completed during the reporting period also took between 181 to 365 days to complete (706, or 39.4%), and 45 (or 2.5%) took more than a year to complete. On average, TC took 179 days to complete requests in 2013–2014 compared to 119 days last year (representing 60 days more to complete a request).Footnote 3
Although 4.6% of the requests completed in 2013‒2014 were completed past the statutory or extended deadline (compared to 21% in 2012–2013), resulting in an “A” grade,Footnote 4 it appears that this rate was obtained through the widespread use of long extensions.
TC invoked workload as the principal reason why requests were closed late in 2013–2014 (59 requests, or 71.1%).
Extensions
TC’s use of extensions increased significantly in 2013–2014 compared to the last reporting period (from 861 to 2,322 extensions, an increase of 170%). The number of extensions per request completed (1.29) was about 5 times higher than the proportion government-wide (0.26).
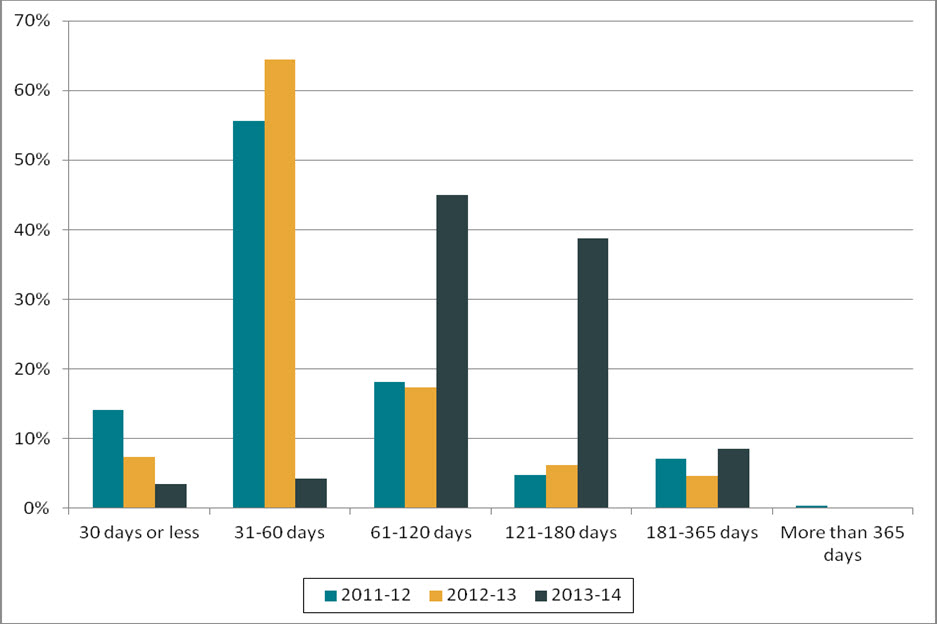
The extensions taken were generally for longer periods of time. The proportion of extensions for 30 days or less went down from 7.3% in 2012–2013 to 3.4% in 2013–2014. Extensions for 9(1)(b) were especially long, with the vast majority of them being for a period exceeding 120 days (89.5%).
Figure 1. Length of extensions (2011–2012 to 2013–2014)
Text version
Figure 1 is a bar chart with vertical bars, representing the length of extensions taken by TC during each reporting period between 2011–2012 and 2013–2014. The results are as follows:
| Reporting period | 30 days or less | 31-60 days | 61-120 days | 121-180 days | 181-365 days | More than 365 days |
|---|---|---|---|---|---|---|
| 2011–2012 | 14.14% | 55.56% | 18.18% | 4.71% | 7.07% | 0.34% |
| 2012–2013 | 7.32% | 64.46% | 17.31% | 6.16% | 4.65% | 0.12% |
| 2013–2014 | 3.45% | 4.26% | 44.96% | 38.76% | 8.57% | 0.00% |
This is mostly due to the number of extensions taken for consultations (section 9(1)(b)), which increased by 464% compared to 2012–2013 (from 190 to 1,072). However, 200 requests were also extended under section 9(1)(a) where the requests involved “staff who were in the field and whose focus was on investigative work and on Transport Canada’s safety and security mandate over the initial period of influx of requests”.
Of particular concern is the use of extensions for requests where no records were found. As noted in TC's report, 349 extensions (or 15%) were taken under section 9(1)(a) (which requires the review of a large number of records or necessitates a search through a large number of records, and would unreasonably interfere with the operations of the institution) but yielded no records. Another 318 extensions (or 13.7%) were taken to consult on records that did not exist.
Disclosure
Of the 1,794 requests completed, about 12% of them were disclosed entirely. This proportion was 11% in 2012–2013. This is lower than the government-wide proportion (26.9%).
The proportion of pages processed that were disclosed went down considerably, from 86% in 2012–2013 to 46% in 2013–2014.
Exemptions/Exclusions
TC applied a total of 2,895 exemptions and 127 exclusions in 2013–2014, a ratio of 1.68 exemptions/exclusions per request completed. This is double the ratio from the last reporting period. In comparison, the ratio government-wide for 2013–2014 was of 1.18.
Frequently applied exemptions included: operations of government (976 times), third-party information (610 times) and personal information (309 times).
Table 2. Performance
| Measures | Reporting Period 2012–2013 |
Reporting Period 2013–2014 |
Difference | |
|---|---|---|---|---|
| Completion of Requests | ||||
| Completion rate | 56.74% | 82.56% | 25.82% | |
| Completion Time | ||||
| % of requests completed within 30 days | 34.39% | 24.58% | -9.81% | |
| Average number of days to complete a request | 119 | 179 | 60 | |
| % of requests closed past statutory or extended deadline | 21.42% | 4.63% | -16.79% | |
| % of consultations from government institution completed within 30 days | 71.22% | 89.72% | 18.5% | |
| % of extensions of 30 days or less | 7.32% | 3.45% | -3.87% | |
| Level of Disclosure | ||||
| % of pages processed that were disclosed | 85.53% | 46% | -39.53% | |
| % of requests completed for which the information was disclosed entirely | 10.99% | 11.98% | 1.09% | |
| % of pages disclosed entirely | 9.63% | 33.64% | 24.01% | |
| Exemptions/Exclusions | ||||
| Number of exemptions/exclusions per request completed | 0.85 | 1.68 | 0.83 | |
Other activities
TC participated in Treasury Board Secretariat’s consultations on the effective management of surges in ATI requests, such as the one that occurred in 2013–2014 following the Lac-Mégantic tragedy.
Complaints
Complaints against TCFootnote 5 increased in 2013–2014 (83 complaints) compared to 2012–2013 (72 complaints). The proportion of administrative complaints was however similar for both reporting period (between 43 and 45%).
Of the complaints received in 2013–2014, 40 were well founded, 13 were not well-founded, 11 were discontinued and 2 were settled. An additional 17 complaints were still pending (as of April 2015).
Footnotes
- Footnote 1
-
According to TC, this decrease in the number of requests received reflects a shift in the approach of a small number of requesters who, rather than submitting several requests for all records related to a specific subject, first requested a list of records and then submitted a second request for the particular records in which they were interested.
- Footnote 2
-
The OIC also identified a number of discrepancies in the 2013-2014 statistical report, possibly affecting TC’s overall performance. At the time of writing, the institution was reviewing the figures.
- Footnote 3
-
Based on response to parliamentary written question Q-485.
- Footnote 4
-
The 2007–2008 OIC report card grading system was used to estimate the grade: A=0 to 5%, B= 5 to 10%, C=10 to 15%, D=15% to 20%, F=more than 20%.
- Footnote 5
-
The numbers reported in this section are based on the OIC’s statistics. The information may not reflect the statistics reported by institutions due to the discrepancies in the methodology used.