2013-2014 Public Works and Government Services Canada
Originally known as the Board of Works, Public Works and Government Services Canada (PWGSC) was created in its current form in 1993 through the amalgamation of several departments. PWGSC provides government departments, boards and agencies with support services for their programs.
In 2013–2014, PWGSC received 718 requests,Note de bas de page 1 a decrease of 11.4% compared to 2012–2013 (810 requests). The institutions also processed proportionally less pages per request completed. The overall decrease in workload has allowed PWGSC to complete proportionally more requests in 2013–2014. As such, PWGSC completed about 83% of requests in inventory, compared to 74.4% in 2012–2013.
While PWGSC’s results in 2013–2014 were similar to those achieved in 2012–2013, they were below government-wide levels on most indicators.
Requests were received in 2013–2014 came from primarily three categories of requestors: the public (35.2%), the private sector (32%) and the media (26.9%).
An additional 214 requests for previously released ATI packages were also released informally during 2013–2014.
Table 1. Workload
| Measures | Reporting Period 2012–2013 |
Reporting Period 2013–2014 |
Difference |
|---|---|---|---|
| Number of requests received | 810 | 718 | -11.36% |
| Number of consultations received (from other government institutions) | 316 | 331 | 4.75% |
| Average number of pages processed per request completed | 514 | 360 | -154 |
| % of requests for which more than 1,000 pages were processed | 11.94% | 7.75% | -4.19% |
| Note: The average number of pages processed per request completed and the percentage of requests for which more than 1,000 pages were processed are calculated from the total of requests completed for which the information was disclosed (in part or totally), exempted/excluded and for requests abandoned. It excludes requests completed for the following dispositions: no records exist, requests transferred and requests treated informally. | |||
About 7.75% of requests required processing of more than 1,000 pages, compared to 11.9% in 2012–2013.Note de bas de page 2 While the average number of pages processed per request significantly increased in 2012–2013 (514 pages), it went down to 360 pages in 2013–2014, which is similar to 2011–2012 (396 pages).
Timeliness
In 2013–2014, PWGSC completed to 345 requests within 30 days or less, which represents 41.7% of requests closed in 2013–2014 (similar to the last reporting period). In comparison, 61% of completed requests government-wide were responded to within 30 days in 2013–2014. The average number of days to complete a request in 2013–2014 was 105 days.Note de bas de page 3
The proportion of requests completed in more than 120 days in 2013–2014 (27.9%) was similar to 2012–2013 but significantly higher than the proportion government-wide (10.7%).
The proportion of requests closed past the statutory or extended deadline increased by about 2.6%, from 8% in 2012–2013 to 10.6% in 2013–2014. The proportion achieved in 2013–2014 represents a “C” grade.Note de bas de page 4 According to PWGSC’s annual report on the administration of the Act, late requests in 2013–2014 took, on average, an additional 149 days to complete, compared to 182 days in 2012–2013. Further, most of the late requests had already been extended (93.2%).
The reasons invoked for missing statutory or extended deadlines included external consultations (39.8%) other reasons (30.68%) and workload (27.3%).Note de bas de page 5
Extension
PWGSC took 673 extensions to complete the 828 requests completed in 2013–2014.Note de bas de page 6 This represents a ratio of about 0.81 extensions per request completed, which is one of the highest ratio among the examined institutions. This is similar to the last reporting period.
Of the 673 extensions taken, 74 extensions (or 11%) were for 30 days or less in 2013–2014. PWGSC also mentioned that, on average, extensions were of 132 days in 2013–2014 (decrease compared to 2012–2013, 174–day average).
Figure 1. Length of extensions (2011–2012 to 2013–2014)
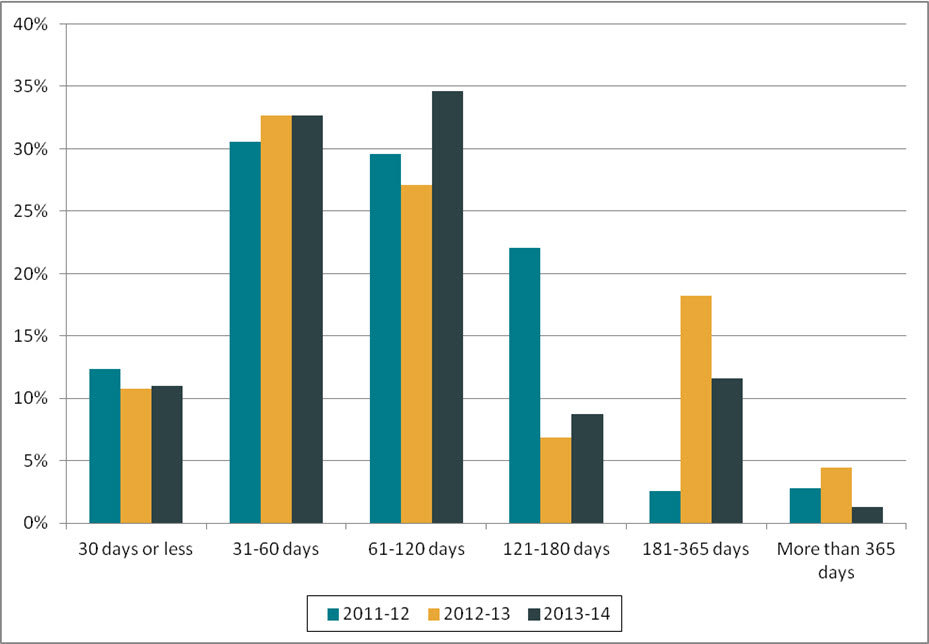
Text version
Figure 1 is a bar chart with vertical bars, representing the length of extensions taken by PWGSC during each reporting period between 2011–2012 and 2013–2014. The results are as follows:
| Reporting period | 30 days or less | 31-60 days | 61-120 days | 121-180 days | 181-365 days | More than 365 days |
|---|---|---|---|---|---|---|
| 2011–2012 | 12.38% | 30.58% | 29.59% | 22.05% | 2.56% | 2.84% |
| 2012–2013 | 10.74% | 32.66% | 27.08% | 6.88% | 18.19% | 4.44% |
| 2013–2014 | 11.00% | 32.69% | 34.62% | 8.77% | 11.59% | 1.34% |
Extensions taken under section 9(1)(b) (consultations other than section 69) represented about 47% of all extensions taken. An additional 38.6% of them were taken to consult a third party, pursuant to section 9(1)(c).
Disclosure
Of the 828 requests completed, 17.9% were disclosed entirely, which represents a 2% increase compared to 2012–2013. However, this proportion is still above the government-wide results (26.8%).
In 2013–2014, about 68.2% of the pages processed were disclosed, compared to 57.8% in 2012–2013.
Exemptions/Exclusions
A total of 1,512 exemptions and 91 exclusions were invoked to withdraw information from disclosure in 2013–2014, representing about 1.94 exemptions/exclusions per request completed. In comparison, this ratio was of 1.91 in 2012–2013.
Most common applied exemptions were: third-party information (469 times), personal information (385 times) and operations of government (252 times). This is comparable to the last reporting period.
Table 2. Performance
| Measures | Reporting Period 2012–2013 |
Reporting Period 2013–2014 |
Difference | |
|---|---|---|---|---|
| Completion of Requests | ||||
| Completion rate | 74.38% | 82.97% | 8.59% | |
| Completion Time | ||||
| % of requests completed within 30 days | 42.31% | 41.67% | -0.64% | |
| Average number of days to complete a request | 105 | 105 | None | |
| % of requests closed past statutory or extended deadline | 8.00% | 10.63% | 2.63% | |
| % of consultations from government institution completed within 30 days | 64.76% | 71.64% | 6.88% | |
| % of extensions of 30 days or less | 10.74% | 11.00% | 0.26% | |
| Level of Disclosure | ||||
| % of pages processed that were disclosed | 57.75% | 68.17% | 10.42% | |
| % of requests completed for which the information was disclosed entirely | 15.87% | 17.87% | 2.00% | |
| % of pages disclosed entirely | 11.59% | 6.52% | -5.07% | |
| Exemptions/Exclusions | ||||
| Number of exemptions/exclusions per request completed | 1.91 | 1.94 | 0.03 | |
Other activities
According to its annual report 2013–2014, PWGSC has updated its internal Policy on the Access to Information to reflect changes made to access to information policies and directives. These modifications included the duty to assist requesters, the access to records in the Minister’s office and suspected contraventions of section 67.1 of the Access to Information Act.
PWGSC also provided 15 training and awareness sessions during 2013–2014 to about 195 employees of the Department.
Complaints
In 2013–2014, the number of complaints received against PWGSCNote de bas de page 7 decreased from 35 in 2012–2013 to 28 in 2013–2014.
Refusal complaints accounted for 17 of the complaints received in 2013–2014. The number of administrative complaints went down from 19 complaints in 2012–2013 to 11 in 2013–2014.
As of April 2015, 9 of the complaints received in 2013–2014 were still pending. Of the completed complaints, 10 were well founded, 6 were not well-founded, 1 was settled and 2 were discontinued.
Footnotes
- Footnote 1
-
According to its annual report on the administration of the Act, most of the requests received by PWGSC were related to the contracting and procurement services provided by PWGSC, including the National Shipbuilding Procurement Strategy and the replacement of the fighter jets.
- Footnote 2
-
According to PWGSC’s annual report on the administration of the Act, 7 requests required the process of more than 5,000 pages in 2013-14.
- Footnote 3
-
Based on response to parliamentary written question Q-485.
- Footnote 4
-
The 2007–2008 OIC report card grading system was used to estimate the grade: A=0 to 5%, B=5 to 10%, C=10 to 15%, D=15 to 20%, F=more than 20%.
- Footnote 5
-
The “other” reasons why an institution completed requests past their statutory or extended deadline, according to the Treasury Board Secretariat’s Guide for the Statistical Report on the Access to Information Act, could be because of the unavailability of key officials, difficulties in obtaining relevant records, labour disputes, and lengthy power outages. The category “other” is defined as reasons other than workload and consultations.
- Footnote 6
-
PWGSC mentioned that 458 completed requests required extensions (representing about 55% of all requests completed in 2013–2014). In 2012–2013, this proportion was of 53%.
- Footnote 7
-
The numbers reported in this section are based on the OIC’s statistics. The information may not reflect the statistics reported by institutions due to the discrepancies in the methodology used.