2013-2014 Public Safety Canada
Public Safety Canada (PS) coordinates and supports the efforts of federal organizations to ensure national security and the safety of Canadians. It works with various stakeholders on issues of emergency management, national security, law enforcement, crime prevention and the protection of Canada's borders. The Public Safety Portfolio encompasses nine organizations for which the Minister of Public Safety is responsible.Footnote 1
PS received 465 requestsFootnote 2 during the reporting period 2013–2014, a decrease of about 6% compared to 2012–2013 (494 requests). Requests treated informally (118) represented 22.4% of completed requests in 2013–2014. These included requests of already released ATI packages.Footnote 3 PS’s overall performance in 2013–2014 was better than the results achieved in 2012–2013 and above government-wide on a number of indicators.
PS completed about 94.1% of all requests in its inventory in 2013–2014, compared to 83.4% in 2012–2013. This represents one of the highest completion rate achieved among the 27 institutions examined in 2013–2014.
The most common source of requests in 2012–2013 was the media (61.3%). An additional 21.7% also came from members of the public. This is similar to results from the last reporting period.
Table 1. Workload
| Measures | Reporting Period 2012–2013 |
Reporting Period 2013–2014 |
Difference |
|---|---|---|---|
| Number of requests received | 494 | 465 | -5.87% |
| Number of consultations received (from other government institutions) | 244 | 255 | 4.51% |
| Average number of pages processed per request completed | 329 | 348 | 19 |
| % of requests for which more than 1,000 pages were processed | 9.93% | 10.76% | 0.83% |
| Note: The average number of pages processed per request completed and the percentage of requests for which more than 1,000 pages were processed are calculated from the total of requests completed for which the information was disclosed (in part or totally), exempted/excluded and for requests abandoned. It excludes requests completed for the following dispositions: no records exist, requests transferred and requests treated informally. | |||
As for the volume of pages, requests completed required the processing of, on average, 348 pages. This is similar to last year, when 329 pages were required. Additionally, about 11% of the requests required the processing of more than 1,000 pages, compared to 10% in 2012–2013 and 6.2% in 2011–2012.
Timeliness
PS responded to 361 requests within 30 days or less (68.5% - a 2.8% decrease compared to 2012–2013). On average, request took longer to complete in 2013–2014 (75 days) compared to 2012-13 (66 days).
The number of requests past the statutory or extended deadline dropped to 2.28% in 2013–2014, representing an “A”Footnote 4 grade. This is an improvement compared to 2012–2013 (6.5%). Extensions were taken for all requests that were closed past the statutory or extended deadline.
Extensions
PS took 224 extensions to complete 527 requests completed in 2013–2014, a ratio of 0.43 extensions per request completed (a decrease compared to 2012–2013, 0.45 extensions per request completed).
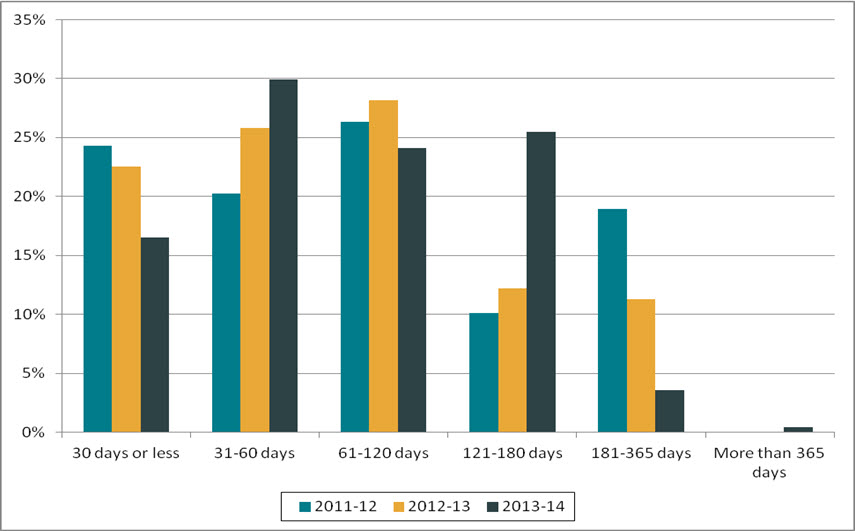
More extensions were proportionally used in 2013–2014 than in 2012–2013. They also tended to be for longer periods of time. In 2013–2014, extensions for 30 days or fewer represented 16.5% of all extensions taken compared to 22.5% in 2012–2013. Extensions of more than 120 days also increased in 2013–2014.
Figure 1. Length of extensions (2011–2012 to 2013–2014)
Text version
Figure 1 is a bar chart with vertical bars, representing the length of extensions taken by PS during each reporting period between 2011–2012 and 2013–2014. The results are as follows:
| Reporting period | 30 days or less | 31-60 days | 61-120 days | 121-180 days | 181-365 days | More than 365 days |
|---|---|---|---|---|---|---|
| 2011–2012 | 24.32% | 20.27% | 26.35% | 10.14% | 18.92% | 0.00% |
| 2012–2013 | 22.54% | 25.82% | 28.17% | 12.21% | 11.27% | 0.00% |
| 2013–2014 | 16.52% | 29.91% | 24.11% | 25.45% | 3.57% | 0.45% |
Most of the extensions in 2013–2014 (71.9%) were taken for consultations under section 9(1)(b). An additional 25.9% were taken under section 9(1)(a). These proportions are similar to the ones observed in 2012–2013.
Disclosure
Of the requests completed, 6.8% of them were disclosed entirely. While this is similar to the last reporting period, it is significantly below the proportion achieved government-wide (26.8% in 2013–2014).
More than half of the pages processed were disclosed (61.1%). In 13.5% of the requests, no records existed.
Exemptions/Exclusions
In 2013–2014, a total of 1,271 exemptions and 220 exclusions were used by PS to protect information. In terms of proportion, this represents a rate of 2.83 exemptions/exclusions per request completed (this rate was of 2.35 in 2012–2013). This is high by comparison to the government-wide level.
Most common applied exemptions included: operations of government (282 times), International affairs and defence (222 times) and law and enforcement (210 times).
Table 2. Performance
| Measures | Reporting Period 2012–2013 |
Reporting Period 2013–2014 |
Difference | |
|---|---|---|---|---|
| Completion of Requests | ||||
| Completion rate | 83.42% | 94.11% | 10.69% | |
| Completion Time | ||||
| % of requests completed within 30 days | 65.69% | 68.50% | 2.81% | |
| Average number of days to complete a request | 66 | 75 | 9 | |
| % of requests closed past statutory or extended deadline | 6.49% | 2.28% | -4.21% | |
| % of consultations from government institution completed within 30 days | 97.96% | 97.62% | -0.34% | |
| % of extensions of 30 days or less | 22.54% | 16.52% | -6.02% | |
| Level of Disclosure | ||||
| % of pages processed that were disclosed | 61.82% | 61.08% | -0.74% | |
| % of requests completed for which the information was disclosed entirely | 6.69% | 6.83% | 0.14% | |
| % of pages disclosed entirely | 7.17% | 4.67% | -2.50% | |
| Exemptions/Exclusions | ||||
| Number of exemptions/exclusions per request completed | 2.35 | 2.83 | 0.48 | |
Other activities
In 2013–2014, the ATIP office mentioned that it was unable to provide training sessions on the Access to Information Act due to “resource levels and a continued high volume of ATI requests”.
Complaints
In 2013–2014, the OIC received 14 complaints against PS,Footnote 5 all of them were refusal complaints. In comparison, 5 complaints were received against this department in 2012–2013 and 4 of them were for refusal.
From the complaints received in 2013–2014, 4 were not well-founded and 4 were discontinued. Only one complaint was well founded, while 5 were still pending (as of April 2015).
Footnotes
- Footnote 1
-
In addition to Public Safety Canada, the Portfolio includes the Canada Border Services Agency (CBSA), the Canadian Security Intelligence Service (CSIS), the Correctional Service of Canada (CSC), the Parole Board of Canada (PBC), and the Royal Canadian Mounted Police (RCMP). However, the present statistics are for Public Safety Canada only and do not include these 5 other institutions aforementioned, as each of them reports to Parliament separately.
- Footnote 2
-
An analysis of the summaries of completed ATI requests available online showed that the information requested was varied. Some of the subject matter areas requested included information pertaining to cyber-crime/cyber-security, the Vancouver Olympics, the events surrounding the arrest of Luka Rocco Magnotta, and information regarding several bills (such as Bill C-19, which amended the Firearms Act and the Criminal Code).
- Footnote 3
-
PS confirmed that requests for released ATI packages were included in the statistical report, under the disposition “treated informally”. Based on the TBS’s guide, requests that are treated informally are formal requests that have been discontinued for an informal treatment. The inclusion of requests for previously released packages in the calculation impacts the overall performance indicators of the institution.
- Footnote 4
-
The 2007–2008 OIC report card system was used to estimate a grade: A=0 to 5%, B=5 to 10%, C=10 to 15%, D=15 to 20%, F= more than 20%.
- Footnote 5
-
The numbers reported in this section are based on the OIC’s statistics. The information may not reflect the statistics reported by institutions due to the discrepancies in the methodology used.