2013-2014 Fisheries and Oceans Canada
The Department of Fisheries and Oceans (DFO) develops and implements policies and programs in support of Canada's scientific, ecological, social and economic interests in oceans and fresh waters, and works towards ensuring these resources benefit current and future generations.
DFO received 417 requests in 2013–2014,Footnote 1 a decrease of 24% compared to 2012–2013 (547).Footnote 2 However, the volume of pages processed increased considerably. DFO’s performance in 2013–2014 declined significantly compared to 2012–2013 results, especially in terms of completion time. Results were also below the government-wide levels.
Of a total of 583 requests in hand, DFO completed 68% of them. This completion rate represents a significant decrease compared to 2012–2013, when 81% of requests were completed. A larger backlog of requests was carried over to the next reporting period might affect DFO’s performance in 2014–2015.
Requests received in 2013–2014 came mostly from members of the public (37.17%), followed by the private sector (28.54%) and the media (19.66%).
DFO reported receiving an additional 128 requests for previously released ATI packages (an increase compared to 91 requests in 2012–2013).
Table 1. Workload
| Measures | Reporting Period 2012–2013 | Reporting Period 2013–2014 | Difference |
|---|---|---|---|
| Number of requests received | 547 | 417 | -23.77% |
| Number of consultations received (from other government institutions) | 288 | 170 | -40.97% |
| Average number of pages processed per request completed | 378 | 538 | 160 |
| % of requests for which more than 1,000 pages were processed | 8.19% | 13.49% | 5.30% |
| Note: The average number of pages processed per request completed and the percentage of requests for which more than 1,000 pages were processed are calculated from the total of requests completed for which the information was disclosed (in part or totally), exempted/excluded and for requests abandoned. It excludes requests completed for the following dispositions: no records exist, requests transferred and requests treated informally. | |||
In 2013–2014, the workload of pages increased considerably, with an average of 538 pages per request completed, compared to 378 in 2012-13. A larger proportion of requests also required processing more than 1,000 pages (from 8.2% to 13.5% in 2013-14).
Timeliness
A total of 184 requests were completed within 30 days or less in 2013–2014, representing about 46.3%. This is 13% lower than in 2012–2013 (59.2%). The proportion of requests that required more than 120 days more than doubled in 2013–2014 (23.9%) compared to the previous reporting period (10.6%). Among those, 8% took more than a year to complete in 2013–2014.
On average, DFO took 104 days to complete a request. This is twice the average time in 2012–2013 (52 days).Footnote 3
The proportion of requests completed past the statutory deadline also increased significantly, from 5.5% in 2012–2013 to 17.3% in 2013–2014; 87% of the requests past deadline had received an extension. According to the OIC ranking, DFO went from a “B” to a “D” grade.Footnote 4
Workload was invoked as the principal reason why requests were closed late (54 requests or 78.3%).
Extensions
In 2013-14, despite completing fewer requests, DFO used 114 more extensions, an increase of 66% compared to 2012–2013. Most extensions in 2013-14 were for consultations (43%) and for interference with operations (40%).
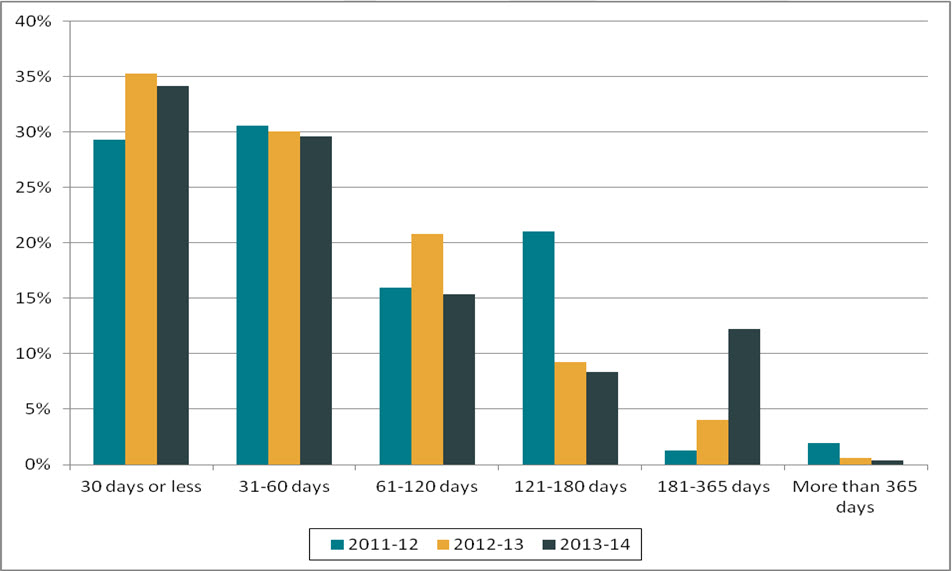
The proportion of extensions that were for 30 days or less in 2013–2014 was similar to the previous reporting period (34% and 35%, respectively). However, the proportion of extensions taken for more than 120 days increased, from 14% in 2012–2013 to 21% in 2013–2014.
Figure 1. Length of extensions (2011–2012 to 2013–2014)
Text version
Figure 1 is a bar chart with vertical bars, representing the length of extensions taken by DFO during each reporting period between 2011–2012 and 2013–2014. The results are as follows:
| Reporting period | 30 days or less | 31-60 days | 61-120 days | 121-180 days | 181-365 days | More than 365 days |
|---|---|---|---|---|---|---|
| 2011–2012 | 29.30% | 30.57% | 15.92% | 21.02% | 1.27% | 1.91% |
| 2012–2013 | 35.26% | 30.06% | 20.81% | 9.25% | 4.05% | 0.58% |
| 2013–2014 | 34.15% | 29.62% | 15.33% | 8.36% | 12.20% | 0.35% |
Disclosure
Information was disclosed entirely for 66 requests in 2013–2014, representing 16.6% of all requests completed. This is below the government-wide full disclosure rate of 26.85% and represents a decrease of 1.5% compared to the previous reporting period.
Exemptions/Exclusions
A total of 747 exemptions and 98 exclusions were applied in 2013–2014, a proportion of 2.13 exemptions/exclusions per request completed. This represents a considerable increase compared to 2012–2013 (1.48 exemptions/exclusions per request completed).
Most applied exemptions in 2013-14 included: government operations (220 times), personal information (182 times) and third party information (128 times). This is similar to the previous reporting period.
Table 2. Performance
| Measures | Reporting Period 2012–2013 |
Reporting Period 2013–2014 |
Difference | |
|---|---|---|---|---|
| Completion of Requests | ||||
| Completion rate | 73.18% | 68.10% | -5.08% | |
| Completion Time | ||||
| % of requests completed within 30 days | 59.16% | 46.35% | -12.81% | |
| Average number of days to complete a request | 52 | 104 | 52 | |
| % of requests closed past statutory or extended deadline | 5.52% | 17.32% | 11.80% | |
| % of consultations from government institution completed within 30 days | 77.82% | 83.24% | 5.42% | |
| % of extensions of 30 days or less | 35.26% | 34.15% | -1.11% | |
| Level of Disclosure | ||||
| % of pages processed that were disclosed | 50.02% | 62.23% | 12.21% | |
| % of requests completed for which the information was disclosed entirely | 18.10% | 16.62% | -1.48% | |
| % of pages disclosed entirely | 27.48% | 12.40% | -15.08% | |
| Exemptions/Exclusions | ||||
| Number of exemptions/exclusions per request completed | 1.48 | 2.13 | 0.65 | |
Other activities
DFO recognizes the importance of sound information management practices for ATIP performance. As such, the institution reported having put in place an official IM Strategy as well as a three-year action plan (2011–2014). The next action plan (2014–2017) will focus, among other things, on implementing the Directive on Open Government.
DFO’s ATIP office also developed a new ATIP training program for all employees. This new program is mandatory for Directors and Directors General. This training was scheduled to start in the summer of 2014.
Complaints
The number of complaints received against DFOFootnote 5 went up slightly from 18 complaints in 2012–2013 to 21 in 2013–2014.
The proportion of administrative complaints increased by about 12% in 2013–2014, representing 61.9% of complaints received that year.
Ten of the 21 complaints received in 2013–2014 were considered well-founded. Discontinued and still pendingFootnote 6 complaints accounted for 2 and 4 complaints, respectively. Finally, 4 complaints were not well-founded and one was settled.
Footnotes
- Footnote 1
-
Requests concerned various subjects and were not issue-driven. Examples of information requested included: information regarding the experimental lake areas, specific vessels/ships incidents, assessment of fishing areas and the oil sands/pipelines.
- Footnote 2
-
This increase follows however a 50% increase in 2012–2013 compared to the previous year.
- Footnote 3
-
Based on response to parliamentary written question Q-485.
- Footnote 4
-
The 2007–2008 OIC report card grading system was used to estimate the grade: A=0 to 5%, B= 5 to 10%, C=10 to 15%, D=15% to 20%, F=more than 20%.
- Footnote 5
-
The numbers reported in this section are based on the OIC’s statistics. The information may not reflect the statistics reported by institutions due to the discrepancies in the methodology used.
- Footnote 6
-
As of April 2015.