2013-2014 Citizenship and Immigration Canada
Citizenship and Immigration Canada (CIC) was created in 1994 to link citizenship and immigration services. In 2008, the department’s portfolio was expanded to include multiculturalism. CIC’s mandate includes, among other things, the selection and application processing of foreign nationals as permanent and temporary residents, the development of Canada’s admissibility policy, and the setting of conditions for entering and remaining in Canada.
In 2013–2014, CIC received 29,281 requests,Footnote 1 by far the largest number of requests of all institutions (representing 48.7% of all requests). CIC’s results in 2013–2014 were below the ones achieved in the previous reporting period. However, it continued to perform above government-wide results.
CIC completed 27,407 requests in 2013–2014, 5.3% more than in the last reporting period. It ended the 2013–2014 reporting period with 89.9% of all its requests completed (3,097 requests have been carried over to 2014–2015). This completion rate is down from the completion rate of 95.6% achieved in 2012–2013.
More than half of the requests received by CIC in 2013–2014 came from businesses (57%), mostly consultants and lawyers requesting personal information files on behalf of their clients. These files did not involve processing a large volume of pages, as only 0.17% of the requests completed required processing more than 1,000 pages.
Table 1. Workload
| Measures | Reporting Period 2012–2013 |
Reporting Period 2013–2014 |
Difference |
|---|---|---|---|
| Number of requests received | 25,010 | 29,281 | 17.08% |
| Number of consultations received (from other government institutions) | 188 | 178 | -5.32% |
| Average number of pages processed per request completed | 60 | 48 | -12 |
| % of requests for which more than 1,000 pages were processed | 0.32% | 0.17% | -0.15% |
| Note: The average number of pages processed per request completed and the percentage of requests for which more than 1,000 pages were processed are calculated from the total of requests completed for which the information was disclosed (in part or totally), exempted/excluded and for requests abandoned. It excludes requests completed for the following dispositions: no records exist, requests transferred and requests treated informally. | |||
Timeliness
In terms of timeliness, CIC completed about 67.2% of requests within 30 days or less, a decrease of 7.4% compared to the previous reporting period. The average time to complete a request also increased by 6 days, from 30 days in 2012–2013 to 36 in 2013–2014.Footnote 2
The proportion of requests closed past the statutory deadline more than doubled this year: from 6.6% in 2012–2013 to 13.9% in 2013–2014. This rate represents a “C” grade.Footnote 3 Workload was identified as the principal reason for completing requests late (about 90% of the time).
Extensions
In order to complete 27,407 requests, CIC took a total of 1,531 extensions in 2013–2014, a proportion of 0.06 extension per request completed. These extensions were for longer periods this year, as only 6.6% of them were taken for a period not exceeding 30 days. This is a significant drop compared to 2012–2013, where 71.6% of extensions taken were for 30 days or less. In fact, most of the extensions taken in 2013–2014 were for a 31 to 60 days (86.4%).
Most (86%) were taken under section 9(1)(a) (interference with operations).
Figure 1. Length of extensions (2011–2012 to 2013–2014)
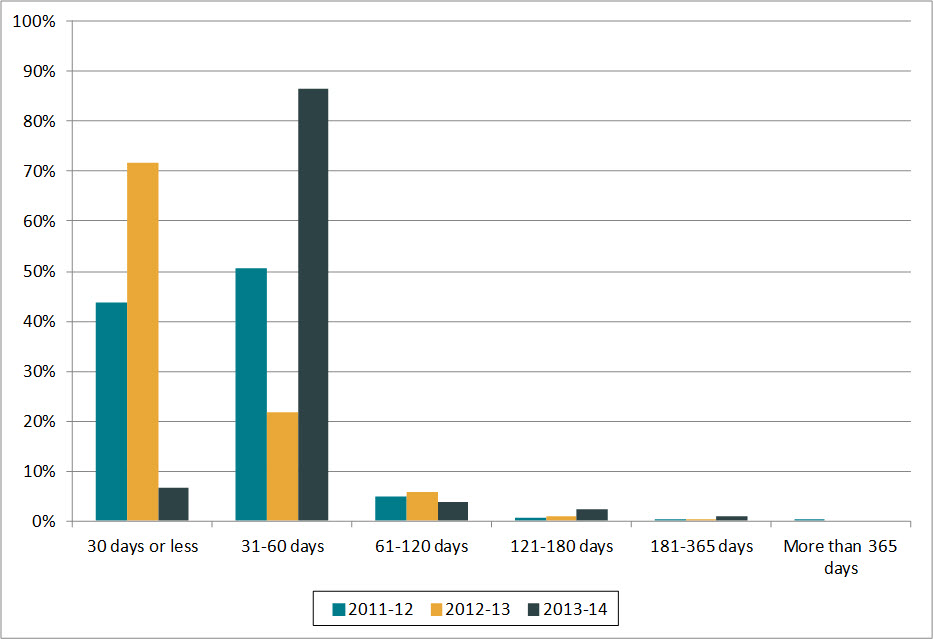
Text version
Figure 1 is a bar chart with vertical bars, representing the length of extensions taken by CIC during each reporting period between 2011–2012 and 2013–2014. The results are as follows:
| Reporting period | 30 days or less | 31-60 days | 61-120 days | 121-180 days | 181-365 days | More than 365 days |
|---|---|---|---|---|---|---|
| 2011–2012 | 43.66% | 50.65% | 4.85% | 0.63% | 0.18% | 0.03% |
| 2012–2013 | 71.62% | 21.75% | 5.69% | 0.79% | 0.16% | 0.00% |
| 2013–2014 | 6.60% | 86.41% | 3.85% | 2.35% | 0.78% | 0.00% |
Disclosure
Of the 27,407 requests completed, 33.4%% were disclosed entirely, an increase of about 9% compared to the results achieved in 2012–2013. However, the proportion of pages that were disclosed decreased from 84.2% in 2012–2013 to 58.9% in 2013–2014.Footnote 4
Exemptions/Exclusions
In 2013–2014, a total of 22,062 exemptions and 155 exclusions were applied, a proportion of 0.81 exemptions/exclusions per request completed. In 2012–2013, this proportion was 0.88.
Most applied exemptions in 2013–2014 included: personal information (11,057 requests), national defence and international affairs (7,740) and law enforcement and investigations (2,471).
Table 2. Performance
| Measures | Reporting Period 2012–2013 |
Reporting Period 2013–2014 |
Difference | |
|---|---|---|---|---|
| Completion of Requests | ||||
| Completion rate | 95.57% | 89.85% | -5.72% | |
| Completion Time | ||||
| % of requests completed within 30 days | 74.62% | 67.2% | -7.42% | |
| Average number of days to complete a request | 30 | 36 | 6 | |
| % of requests closed past statutory or extended deadline | 6.61% | 13.91% | 7.3% | |
| % of consultations from government institution completed within 30 days | 67.74% | 46.88% | -20.86% | |
| % of extensions of 30 days or less | 71.62% | 6.6% | -65.02% | |
| Level of Disclosure | ||||
| % of pages processed that were disclosed | 84.22% | 58.92% | -25.3% | |
| % of requests completed for which the information was disclosed entirely | 24.52% | 33.36% | 8.84% | |
| % of pages disclosed entirely | 14.02% | 33.47% | 19.45% | |
| Exemptions/Exclusions | ||||
| Number of exemptions/exclusions per request completed | 0.88 | 0.81 | -0.07 | |
Other activities
CIC was the lead department for the “ATIP online portal” pilot project. According to CIC’s annual report, this initiative was beneficial for the institution, as it helped the ATIP office move to an “almost entirely paperless environment”.
CIC also mentioned sharing best practices through formal and informal consultations with various other organizations such as the Canada Border Services Agency (CBSA), the Canada Revenue Agency (CRA) or the Canadian Security Intelligence Service (CSIS).
Complaints
The number of complaints received by the OIC against CICFootnote 5 went up from 109 in 2012–2013 to 305 in 2013–2014.
About half of the complaints received in 2013–2014 were administrative complaints (179 complaints). The proportion of administrative complaints increased significantly from 24.8% (27 complaints) in 2012–2013 to 58.7% (179 complaints) in 2013–2014.
Of the complaints received, 161 were well-founded, 28 were not well-founded, 38 were settled and 57 were discontinued. Finally, 21 of them were still pending as of April 2015.
Footnotes
- Footnote 1
-
Since July 2013, CIC received primary responsibility for the passport program. For 2013–2014, CIC reported Passport Canada’s access requests separately, as the passport program still used a separate ATIP request tracking and processing system to ensure consistency throughout the transition. However, all passport program ATIP requests will be processed through regular CIC ATIP channels as of 2014–2015.
- Footnote 2
-
Based on response to parliamentary written question Q-485.
- Footnote 3
-
The 2007–2008 OIC report card grading system was used to estimate a grade: A= 0 to 5%; B= 5 to 10%; C= 10 to 15%; D=15 to 20%, F=more than 20%.
- Footnote 4
-
CIC reported that this decrease was due to the increased use of a single electronic system for the processing of immigration and citizenship cases.
- Footnote 5
-
The numbers reported in this section are based on the OIC’s statistics. The information may not reflect the statistics reported by institutions due to the discrepancies in the methodology used.