2013-2014 Canada Revenue Agency
Canada Revenue Agency (CRA) administers tax laws for the Government of Canada and for most of the provinces and territories. It also administers various social and economic benefit and incentive programs delivered through the tax system.
In 2013–2014, CRA received 2,751 new requests during the reporting period, a decrease of 12% compared to 2012–2013 (3,137 requests). CRA was also the third ranked institution in terms of requests received in 2013–2014, representing 4.6% of all requests received government-wide.
CRA is one of the institutions that processed the most pages in 2013–2014 – 1.6 million pages (an increase of 36% as compared to 2012–2013). This represents an average of 638 pages per request completed.Footnote 1
CRA’s performance in 2013–2014 was similar to that of the previous year, but remained below government-wide results.
CRA completed 82.5% of all requests in its inventory in 2013–2014, which is similar to the completion rate achieved in the previous year (82.9%).
The majority of requests received came from the public (55.3%). CRA also noted a decrease in requests received from a frequent requester this reporting period. It is reported that the development of strategies and best practices by CRA, with the help of the OIC, has proven to be efficient in managing the high volume of requests received from this same requester.
CRA processed 297 requests for previously released ATI packages.
Table 1. Workload
| Measures | Reporting Period 2012–2013 |
Reporting Period 2013–2014 |
Difference |
|---|---|---|---|
| Number of requests received | 3,137 | 2,751 | -12.30% |
| Number of consultations received (from other government institutions) | 83 | 103 | 24.1% |
| Average number of pages processed per request completed | 433 | 638 | 205 |
| % of requests for which more than 1,000 pages were processed | 6.91% | 10.29% | 3.38% |
| Note: The average number of pages processed per request completed and the percentage of requests for which more than 1,000 pages were processed are calculated from the total of requests completed for which the information was disclosed (in part or totally), exempted/excluded and for requests abandoned. It excludes requests completed for the following dispositions: no records exist, requests transferred and requests treated informally. | |||
Timeliness
CRA responded to 1,343 requests within 30 days or less, which represents about 48% of all requests completed (of which, 18.4% yielded no records or were abandoned). This proportion is similar to the one achieved in 2012–2013. However, CRA closed fewer requests in more than 120 days (from 369 in 2012–2013 to 255 in 2013–2014).
Additionally, CRA improved the proportion of requests closed past their statutory or extended deadline this reporting period, from 14.5% in 2012–2013 to 11.8% in 2013–2014. This proportion represents a “C” grade.Footnote 2 However, 235 late requests (or 71.4%) had already been extended. Furthermore, 21 of these late requests took an additional year to be answered. CRA noted in its annual report that it continues to strive toward its goal of closing all requests by its statutory or extended deadline. The high volume of pages to process had a direct impact on CRA’s ability to achieve this goal.
Extensions
CRA took a total of 1,229 extensions to complete 2,795 requests in 2013–2014. The proportion of extensions that were for less than 30 days went down compared to the previous reporting period (from 60% to 40%).
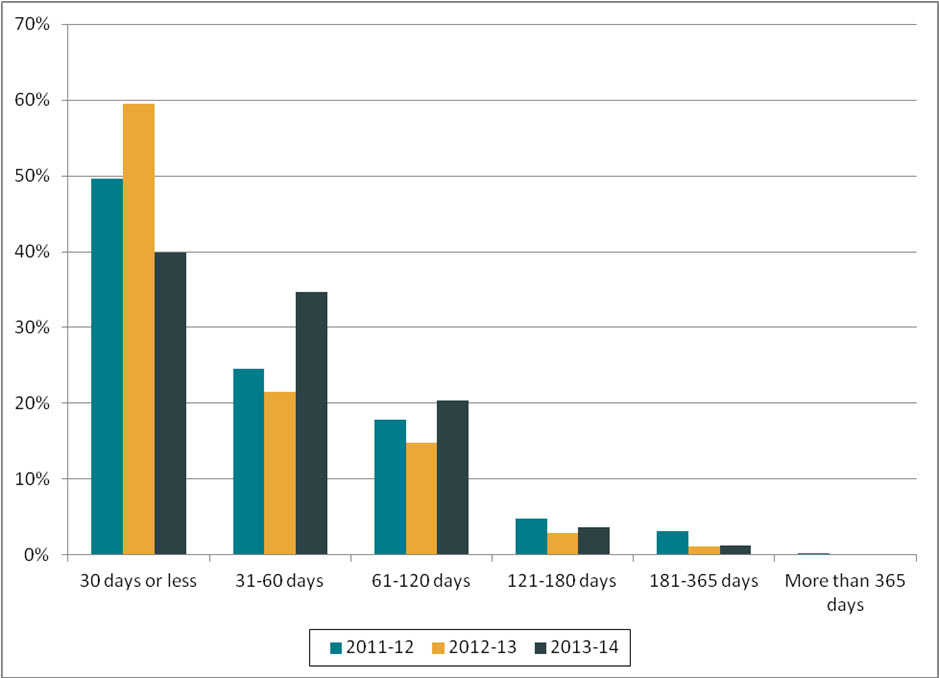
Figure 1. Length of extensions (2011–2012 to 2013–2014)
Text version
Figure 1 is a bar chart with vertical bars, representing the length of extensions taken by CRA during each reporting period between 2011–2012 and 2013–2014. The results are as follows:
| Reporting period | 30 days or less | 31-60 days | 61-120 days | 121-180 days | 181-365 days | More than 365 days |
|---|---|---|---|---|---|---|
| 2011–2012 | 49.57% | 24.52% | 17.84% | 4.74% | 3.14% | 0.20% |
| 2012–2013 | 59.48% | 21.56% | 14.85% | 2.88% | 1.15% | 0.07% |
| 2013–2014 | 39.87% | 34.66% | 20.42% | 3.66% | 1.22% | 0.16% |
Almost all extensions (98%) were taken under section 9(1)(a) (interference with operations). This is similar to 2012–2013 results.
Disclosure
Of the 2,795 requests completed, 17% were disclosed entirely in 2013–2014. While still low, this proportion is above the one achieved in 2012–2013.
While a large percentage of the pages processed were disclosed (79.4%), only a few of the disclosed pages were disclosed entirely (2.7%). In comparison, 86.3% of pages processed were disclosed and 4.3% of them were disclosed entirely in 2012–2013.
Exemptions/Exclusions
In 2013–2014, a total of 3,921 exemptions and 230 exclusions were applied, a proportion of 1.49 exemptions/exclusions per request completed. This proportion was of 1.53 in 2012–2013.
Most applied exemptions included section 24 — Statutory prohibitions (1,240 requests), section 19 — Personal information (915 requests) and section 16 — Law enforcement and investigation (900 requests).
Table 2. Performance
| Measures | Reporting Period 2012–2013 |
Reporting Period 2013–2014 |
Difference | |
|---|---|---|---|---|
| Completion of Requests | ||||
| Completion rate | 82.90% | 82.52% | -0.38% | |
| Completion Time | ||||
| % of requests completed within 30 days | 48.52% | 48.05% | -0.47% | |
| Average number of days to complete a request | 64 | N/A | N/A | |
| % of requests closed past statutory or extended deadline | 14.53% | 11.77% | -2.76 | |
| % of consultations from government institution completed within 30 days | 41.43% | 56.9% | 15.47% | |
| % of extensions of 30 days or less | 59.48% | 39.87% | -19.61% | |
| Level of Disclosure | ||||
| % of pages processed that were disclosed | 86.26% | 79.39% | -6.87% | |
| % of requests completed for which the information was disclosed entirely | 14.04% | 17.07% | 3.03% | |
| % of pages disclosed entirely | 4.27% | 2.67% | -1.60% | |
| Exemptions/Exclusions | ||||
| Number of exemptions/exclusions per request completed | 1.53 | 1.49 | -0.04 | |
Other activities
During Right to Know Week, CRA organized an online forum for CRA’s employees. They were invited to suggest ways in which CRA could increase and improve the proactive disclosure of its information to the public.
Since a significant amount of access requests are related to CRA’s procedure manuals, CRA’s ATIP office has prepared a virtual library project which, if approved, could be implemented in 2014–2015. The release of these manuals on CRA’s website could help reduce the number of formal access requests to be processed by CRA. This would also support CRA’s objective to release more information informally and follows the Information Commissioner’s recommendation.
A dashboard report that provides information about the current state of all ATIP requests is produced by CRA’s ATIP office on a monthly basis. This report is use to monitor, among other things, the timeliness of each process (intake, search, etc.) and to measure the ATIP office’s performance. The Assistant Commissioner (Public Affairs Branch) is also regularly informed about it.
Complaints
The OIC received a total of 283 complaints against CRAFootnote 3 in 2013–2014, compared to 336 complaints in 2012–2013 (decrease of 18.7%).
Of the 283 complaints registered in 2013–2014, 187 of them were for refusal and 96 were related to administrative matters. This is proportionally similar to 2012–2013.
As for the disposition of complaints registered in 2013–2014, 76 were well founded, 27 were not well-founded and 2 were settled. An additional 78 complaints were discontinued and 100 were still pending, as of April 2015.
Footnotes
- Footnote 1
-
While 54.7% of the requests closed required processing less than 100 pages, almost 10.3% of them required processing more than 1,000 pages.
- Footnote 2
-
The 2007–2008 OIC report card grading system was used to estimate the grade: A=0 to 5%, B= 5 to 10%, C=10 to 15%, D=15% to 20%, F=more than 20%.
- Footnote 3
-
The numbers reported in this section are based on the OIC’s statistics. The information may not reflect the statistics reported by institutions due to the discrepancies in the methodology used.