2013-2014 Canada Border Services Agency
The Canada Border Services Agency (CBSA) is part of the Public Safety Canada portfolio. The Agency is responsible for providing border services in order to facilitate the free flow of persons and goods.
Overall, CBSA showed signs of improvement in 2013–2014 compared to the previous reporting period, despite an increased workload.
In 2013–2014, CBSA received 4,671 requests,Footnote 1 an increase of 48.4% compared to 2012–2013, where 3,147 requests were received. CBSA was also the second-ranked institution in terms of the number of requests received under the Access to Information Act, representing close to 7.8% of all requests received government-wide in 2013–2014. CBSA completed 77.6% of all requests in its inventory in 2013–2014 (compared to 70.7% in 2012–2013).
The vast majority (77.5%) of requests received by CBSA were from members of the public. Again this reporting period, an important amount of requests received (57.2%) by CBSA came from individuals seeking their Traveller History Report (THR).Footnote 2
Since requests for THRs are usually not complex to process, the volume of pages processed by CBSA in 2013–2014 was lower than in 2012–2013. The average number of pages processed per request went down from 112 to 101 pages. Additionally, only 1.85% of requests completed required processing 1,000 pages or more.
Table 1. Workload
| Measures | Reporting Period 2012–2013 |
Reporting Period 2013–2014 |
Difference |
|---|---|---|---|
| Number of requests received | 3,147 | 4,671 | 48.43% |
| Number of consultations received (from other government institutions) | 366 | 282 | -22.95% |
| Average number of pages processed per request completed | 112 | 101 | -11 |
| % of requests for which more than 1,000 pages were processed | 2.27% | 1.85% | -0.42% |
| Note: The average number of pages processed per request completed and the percentage of requests for which more than 1,000 pages were processed are calculated from the total of requests completed for which the information was disclosed (in part or totally), exempted/excluded and for requests abandoned. It excludes requests completed for the following dispositions: no records exist, requests transferred and requests treated informally. | |||
Timeliness
Approximately 77% of requests closed during the reporting period were completed within 30 days (of which, 12.7% within 15 days), which represents a significant improvement compared to results achieved in 2012–2013 (71%). The average time to complete a request was 44.5 days.Footnote 3
CBSA was also able to reduce the proportion of requests closed past their statutory or extended deadline by 2.76%, from 11.93% in 2012–2013 to 9.17%. This percentage represents a “B” grade.Footnote 4 Of the late requests, about 46% were 30 days or less overdue.
CBSA invoked workload (44.4% of the time) and the category “other”Footnote 5 (48.1% of the time) as the reasons for lateness.
Extensions
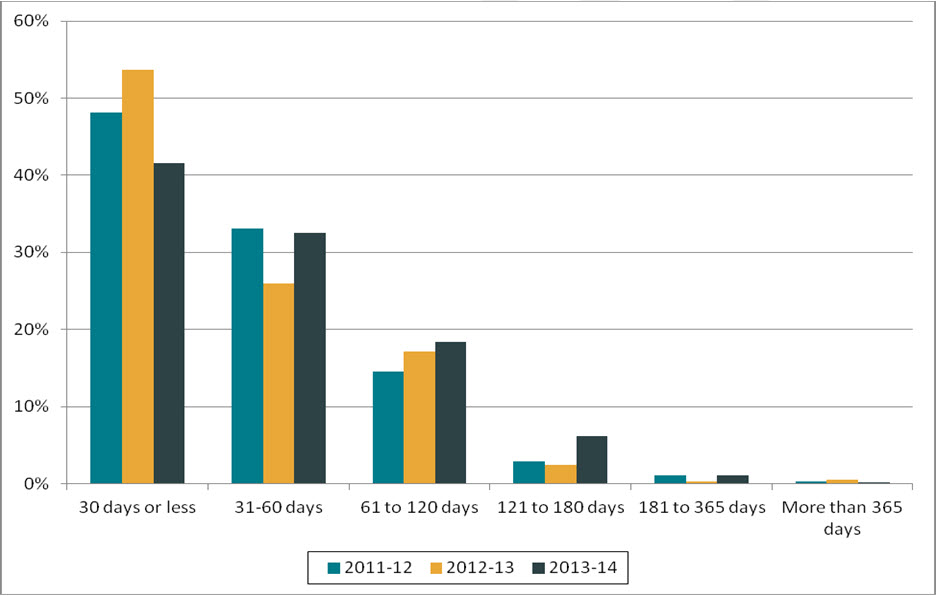
CBSA took a total of 467 extensions in 2013–2014, a ratio of 0.11 extensions per request completed (compared to 0.14 in 2012–2013). Most of the extensions taken in 2013–2014 were for less than 30 days (41.5%). This proportion is about 12% lower than the one reported in 2012–2013.
Figure 1. Length of extensions (2011–2012 to 2013–2014)
Text version
Figure 1 is a bar chart with vertical bars, representing the length of extensions taken by CBSA during each reporting period between 2011–2012 and 2013–2014. The results are as follows:
| Reporting period | 30 days or less | 31-60 days | 61-120 days | 121-180 days | 181-365 days | More than 365 days |
|---|---|---|---|---|---|---|
| 2011–2012 | 48.18% | 33.07% | 14.58% | 2.86% | 1.04% | 0.26% |
| 2012–2013 | 53.68% | 25.98% | 17.16% | 2.45% | 0.25% | 0.49% |
| 2013–2014 | 41.54% | 32.55% | 18.42% | 6.21% | 1.07% | 0.21% |
About 65% of them were taken for consultations pursuant to section 9(1)(b) of the Access to Information Act. The proportion of extensions taken under section 9(1)(a) (interference with operations) decreased by 6% from 2012–2013 to 2013–2014.
Disclosure
Of the 4,079 requests completed in 2013–2014, 54.6% were disclosed entirely, compared to 45% in 2012–2013. This is a significant improvement and is partly explained by the large number of requests for THRs.
Most of the pages processed were also disclosed in 2013–2014 (75.6%). This is similar to the last reporting period. However, only a few of the pages disclosed (11.2%) were disclosed entirely.
Exemptions/Exclusions
The number of exemptions and exclusions used by CBSA increased in 2013–2014 compared to the previous reporting period. On average, about 1.06 exemptions/exclusions were used per request completed. This proportion was 1.02 in 2012–2013.
The most cited exemptions for 2013–2014 were: subsection 19 (1,164), paragraph 16(1)(c) (823) and paragraph 16(2)(c) (400). These three exemptions represented about 56% of all exemptions used by CBSA.
Table 2. Performance
| Measures | Reporting Period 2012–2013 |
Reporting Period 2013–2014 |
Difference | |
|---|---|---|---|---|
| Completion of Requests | ||||
| Completion rate | 83.05% | 77.56% | -5.49% | |
| Completion Time | ||||
| % of requests completed within 30 days | 70.67% | 76.86% | 6.19% | |
| Average number of days to complete a request | 43.5 | 44.5 | 1 | |
| % of requests closed past statutory or extended deadline | 11.93% | 9.17% | -2.76% | |
| % of consultations from government institution completed within 30 days | 68.47% | 60.52% | -7.95% | |
| % of extensions of 30 days or less | 53.68% | 41.54% | -12.14% | |
| Level of Disclosure | ||||
| % of pages processed that were disclosed | 78.36% | 75.60% | -2.76% | |
| % of requests completed for which the information was disclosed entirely | 44.97% | 54.60% | 9.63% | |
| % of pages disclosed entirely | 8.36% | 11.19% | 2.83% | |
| Exemptions/Exclusions | ||||
| Number of exemptions/exclusions per request completed | 1.02 | 1.06 | 0.04 | |
Other activities – as reported in the Annual Report
CBSA’s ATIP Division developed a questionnaire aimed at obtaining feedback about internal processing of ATIP requests. Employees involved in the process of requests will be given an opportunity to provide comments and suggestions on the how to improve these processes.
The ATIP Division also organizes quarterly conference calls with the ATIP Liaison Officers in order to exchange information about best practices and issues/challenges encountered and build better relationship between them. These conference calls have proven to be useful in providing the ATIP Liaison Officers with the assistance required to perform their duties.
Performance of the ATIP Division and of the Offices of Primary Interest on the administration of the Access to Information Act is also monitored closely. The Agency’s Executive Committee is briefed on the overall performance on a quarterly basis and this information is also included in the Agency’s Performance Summary.
Complaints
In 2013–2014, a total of 106 new complaints were registered by the OICFootnote 6 against CBSA: 49 were related to administrative matters and 57 refusal complaints. This is an increase of 68.3% compared to 2012–2013 (63 new complaints).
As for the disposition of requests received in 2013–2014, 50 were well-founded, 21 settled, 13 not well-founded, 12 were discontinued and 10 were still pending.Footnote 7
Footnotes
- Footnote 1
-
The Summaries of completed ATI requests available online shows that other requested information included: lists and information regarding seizures (drugs, alcoholic beverages, weapons, etc.) made at borders, specific data on specific activities at the border between the United States and Canada and briefing notes on various subjects.
- Footnote 2
-
CBSA reports that it is working closely with Citizenship and Immigration Canada (CIC) and Service Canada on a way to give them access to the CBSA database. This, it is expected, will reduce considerably the process of access to information requests for THRs.
- Footnote 3
-
Based on response to parliamentary written question Q-485.
- Footnote 4
-
The 2007–2008 OIC report card grading system was used to estimate the grade: A=0 to 5%, B=5 to 10%, C=10 to 15%, D=15% to 20%, F=more than 20%.
- Footnote 5
-
The “other” reasons why an institution completed requests past their statutory deadline, according to the Treasury Board Secretariat’s Guide for the Statistical Report on the Access to Information Act, could be because of the unavailability of key officials, difficulties in obtaining relevant records, labour disputes, and lengthy power outages. The category “other” is defined as reasons other than workload and consultations.
- Footnote 6
-
The numbers reported in this section are based on the OIC’s statistics. The information may not reflect the statistics reported by institutions due to the discrepancies in the methodology used.
- Footnote 7
-
As of April 2015.