2014-2015 Royal Canadian Mounted Police
Overall performanceFootnote 1
The Royal Canadian Mounted Police (RCMP) showed improvement in 2014-2015. Despite a substantial increase of 93.2% in the number of requests received in the previous year, the RCMP increased the proportion of requests completed within 30 days by 30.7%. This report provides comparative statistics for the last three periods (2012-2015).
Workload
The RCMP received 3,343 requests under the Access to Information Act (the Act), representing 4.9% of total requests received across government in 2014-2015. In general, we observe a substantial increase in the number of requests since 2012 (see Table 1). The majority of requests received by the RCMP were from the public (70.4%), followed by the media (14.4%). The request inventory in these two categories increased by 92.6% and 51.1% respectively from 2013-2014.
The RCMP completed 3,356 requests this reporting period. The completion rateFootnote 2 was 84.6%, which is approximately the same as the government-wide rate of 85.1%. In 2013-2014, the disclosure rate was 73.2%. The RCMP also received 197 informal requests in 2014-2015 and 95.4% were completed within 30 days. The number of consultations received by the RCMP from other federal government institutions decreased from 538 in 2013-2014 to 459 in 2014-2015, representing a decrease of 14.7%.
The total number of pages processed by the RCMP this reporting period was 646,785, which is higher than the 505,610 pages processed in 2013-2014. However, the average number of pages processed per completed request decreased from 360 in 2013-2014 to 229 in 2014-2015.
The information released by the RCMP was mostly in electronic format: 1,395 requests in electronic format compared to 531 in paper format. We observed that the share of requests disclosed in an electronic format increased significantly compared to the previous year (615 in paper and only 354 in electronic format).
Table 1. Workload
| Measures | 2012-2013 | 2013-2014 | 2014-2015 |
|---|---|---|---|
| Number of requests received | 1,218 | 1,730 | 3,343 |
| Annual change (%) | - | 42.0% | 93.2% |
| Completed requests | 981 | 1,706 | 3,356 |
| Annual change (%) | - | 73.9% | 96.7% |
| Number of consultations received (from other government institutions) | 652 | 538 | 459 |
| Annual change (%) | - | -17.5% | -14.7% |
| Average number of pages processed per request completed | 1,522 | 360 | 229 |
| % of requests for which more than 1,000 pages were processed | 5.7% | 4.1% | 5.4% |
Request completion time
Timeliness
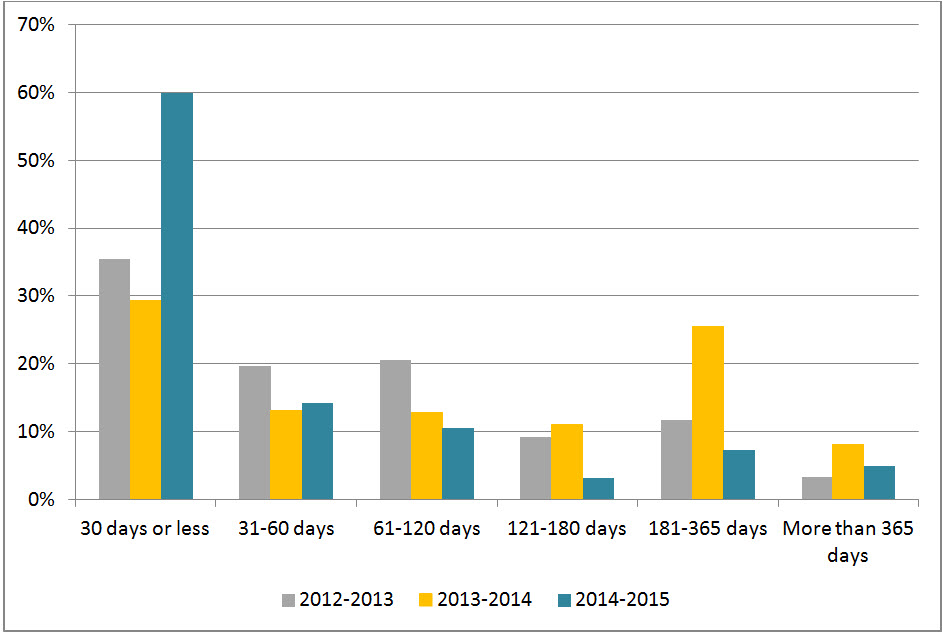
Figure 1 reveals that 60.0% of requests were completed within 30 days or less. This is significantly higher than the results observed in 2013-2014 (29.3%).
Figure 1: Request Completion Time
Text version
Figure 1 is a bar chart with vertical bars, representing the completion time by RCMP during each reporting period between 2012-2013 and 2014-2015. The results are as follows:
| Completion time | 2012-2013 | 2013-2014 | 2014-2015 |
|---|---|---|---|
| 30 days or less | 35.47% | 29.31% | 59.95% |
| 31-60 days | 19.67% | 13.19% | 14.15% |
| 61-120 days | 20.49% | 12.84% | 10.55% |
| 121-180 days | 9.28% | 11.09% | 3.16% |
| 181-365 days | 11.72% | 25.44% | 7.30% |
| More than 365 days | 3.36% | 8.16% | 4.89% |
Extensions
The RCMP took a total of 523 extensions in 2014-2015 compared to 123 in 2013-2014. The most common reason for taking an extension was interference with operations (85.4%) followed by consultations (11.4%), and lastly, third-party notice (3.1%).
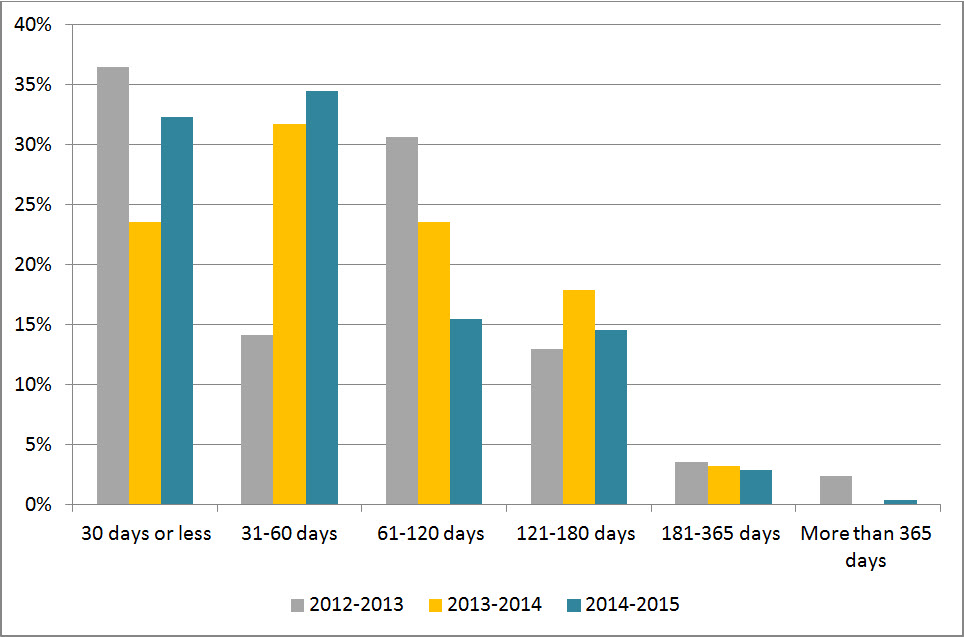
Figure 2 shows that 32.3% of extensions were taken for less than 30 days, which represents an 8.7% increase from to the previous reporting period.
Figure 2: Length of Extensions
Text version
Figure 2 is a bar chart with vertical bars, representing the length of extensions taken by RCMP during each reporting period between 2012-2013 and 2014-2015. The results are as follows:
| Length of extensions | 2012-2013 | 2013-2014 | 2014-2015 |
|---|---|---|---|
| 30 days or less | 36.47% | 23.58% | 32.31% |
| 31-60 days | 14.12% | 31.71% | 34.42% |
| 61-120 days | 30.59% | 23.58% | 15.49% |
| 121-180 days | 12.94% | 17.89% | 14.53% |
| 181-365 days | 3.53% | 3.25% | 2.87% |
| More than 365 days | 2.35% | 0.0% | 0.38% |
Deemed refusals
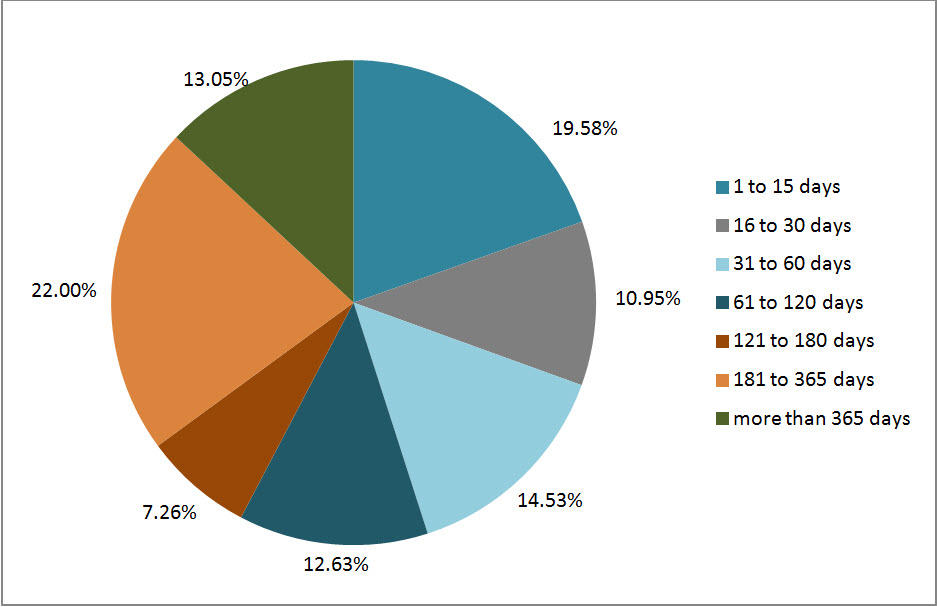
In 2014-2015, the number of requests closed past the statutory deadline was 950, which accounts for 28.3% of completed requests. This rate represents an “F” grade.Footnote 3 The main reason for deemed refusal was workload (78.2%) and internal consultations (13.4%). Figure 3 shows that 30.5% of overdue requests were late by 30 days or less compared to 21.0% in 2013-2014.
Figure 3: Lateness of Overdue Requests
Text version
Figure 3 is a pie chart, representing the delayed days for overdue requests taken by the RCMP in 2014-2015. The results are as follows:
| Number of days | 2014-2015 |
|---|---|
| 1 to 15 days | 19.58% |
| 16 to 30 days | 10.95% |
| 31 to 60 days | 14.53% |
| 61 to 120 days | 12.63% |
| 121 to 180 days | 7.26% |
| 181 to 365 days | 22.00% |
| More than 365 days | 13.05% |
| Total | 100.0% |
Disclosure
Percentage of requests for which information was disclosed
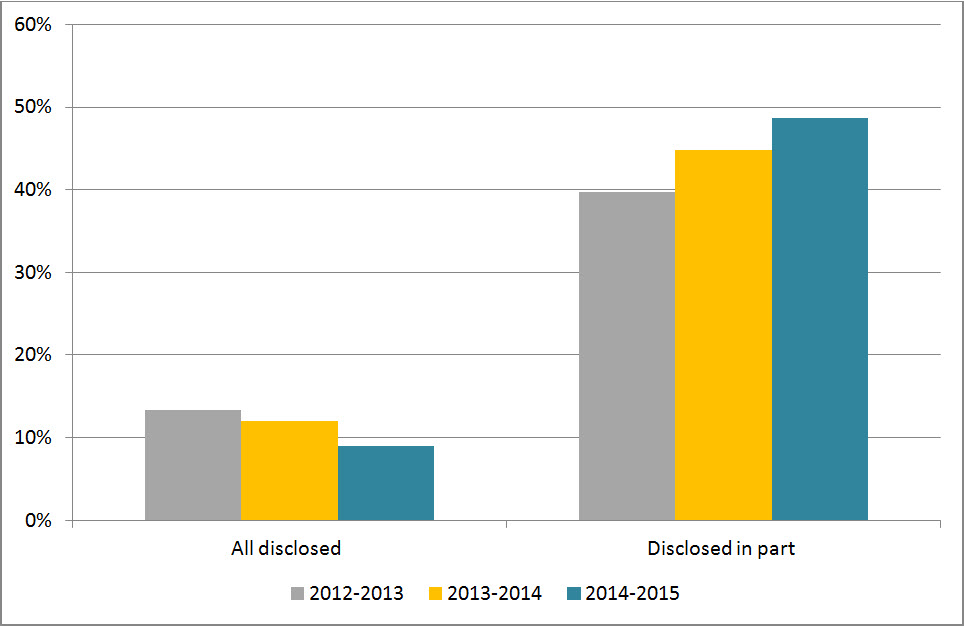
In 2014-2015, 9.0% of completed requests were entirely disclosed, accounting for the RCMP’s lowest disclosure rate since 2012 (see Figure 4). Figure 4 also shows that the rate for partially disclosed requests was 48.7% in 2014-2015, representing an increase of 3.9% from the previous period.
Figure 4: Level of Disclosure
Text version
Figure 4 is a bar-chart with vertical bars, representing the entirely disclosed and disclosed in part requests as proportion of total requests completed by RCMP during each reporting period between 2012-2013 and 2014-2015. The results are as follows:
| Disclosure | 2012-2013 | 2013-2014 | 2014-2015 |
|---|---|---|---|
| All disclosed | 13.35% | 12.02% | 9.03% |
| Disclosed in part | 39.76% | 44.78% | 48.69% |
Exemptions
The total number of exemptions applied in 2014-2015 was 4,956. This is a significant increase from the 2,255 used in the previous period. On average, the number of exemptions used per completed request increased to 1.48 in 2014-2015 compared to 1.32 in 2013-2014 (see Table 2). The most used exemptions in 2014-2015 were section 16 (Law Enforcement and Investigations) (45.2%) and section 19 (Personal Information) (29.3%). This is similar to the previous period (39.2% and 32.5% respectively).
Table 2: Exemptions
| Exemptions | 2012-2013 | 2013-2014 | 2014-2015 |
|---|---|---|---|
| Total number of exemptions | 1,329 | 2,255 | 4,956 |
| Total number of completed requests | 981 | 1,706 | 3,356 |
| Average number of exemptions per completed request | 1.35 | 1.32 | 1.48 |
Complaints at the OIC
The number of complaints receivedFootnote 4 against the RCMP decreased from 185 in 2013-2014 to 178 in 2014-2015. The proportion of refusal to administrative complaints increased substantially, with refusals accounting for 81.4% of complaints, while in 2013-2014 refusal complaints accounted for 44.5%. The number of well-founded complaints decreased this period from 90 to 42. Similarly, we observed a reduction of not well-founded complaints from 35 in 2013-2014 to 20 in 2014-2015. Approximately 25.0% of all complaints were discontinued and 31.4% were still pending.
Footnotes
- Footnote 1
-
Overall performance is based on two primary indicators: % of requests completed within 30 days, % of requests that were fully disclosed.
- Footnote 2
-
The completion rate was calculated using the number of received requests during the reporting period as well as outstanding requests from the previous period.
- Footnote 3
-
The 2007-2008 OIC report card grading system was used to estimate the grade A= 0 to 5%; B= 5 to 10%; C=10 to 15%, D= 15 to 20%, F=20% and more.
- Footnote 4
-
The numbers reported in this section are based on the OIC’s statistics. The information may not reflect the statistics reported by institutions due to the discrepancies in the methodology used.