2014-2015 Public Services and Procurement Canada
Overall performanceFootnote 1Footnote 2
In 2014-2015, Public Services and Procurement Canada (PSPC) improved the percentage of requests completed within 30 days by 8.9% while experiencing a slight decrease in the number of requests received. PSPC also improved the percentage of fully disclosed records by 3.0%. This report provides comparative statistics for the last three periods (2012-2015).
Workload
PSPC received 691 requests under the Access to Information Act (the Act), representing 1.0% of total requests received across government in 2014-2015. In comparison, PSPC received 718 requests in 2013-2014. The majority of requests received in 2014-2015 originated from the media (36.8%), followed by the public (25.2%) and the business sector (24.5%). We note a reduction in the volume of requests from nearly all sources, with the exception of the media which increased by 31.6% from 2013-2014.
PSPC completed 641 requests this reporting period. The completion rateFootnote 3 was 74.4%, which is lower than the government-wide rate of 85.1%. In 2013-2014, the completion rate for PSPC was 83.0%. PSPC also received 182 informal requests in 2014-2015 and 79.7% were completed within 30 days. The number of consultations received by PSPC from other federal government institutions increased from 331 in 2013-2014 to 375.
In total, PSPC processed 194,435 pages which represents a significant reduction compared to the 255,377 pages processed in 2013-2014. We note that the average number of pages processed per completed request decreased by 7 pages (360 pages in 2013-2014 to 352 in 2014-2015).
The information released by PSPC in 2014-2015 was mostly in paper format: 315 requests in paper format and 168 requests in electronic format.
Table 1: Workload
| Measures | 2012-2013 | 2013-2014 | 2014-2015 |
|---|---|---|---|
| Number of requests received | 810 | 718 | 691 |
| Annual change (%) | - | -11.4% | -3.8% |
| Completed requests | 813 | 828 | 641 |
| Annual change | - | 1.8% | -22.6% |
| Number of consultations received (from other government institutions) | 316 | 331 | 375 |
| Annual change (%) | - | 4.7% | 13.3% |
| Average number of pages processed per request completed | 514 | 360 | 352 |
| % of requests for which more than 1,000 pages were processed | 11.9% | 7.7% | 6.3% |
Requests completion time
Timeliness
Figure 1 reveals that 50.5% of requests were completed within 30 days or less, which is 8.9% higher than the results observed in 2013-2014.
Figure 1: Request Completion Time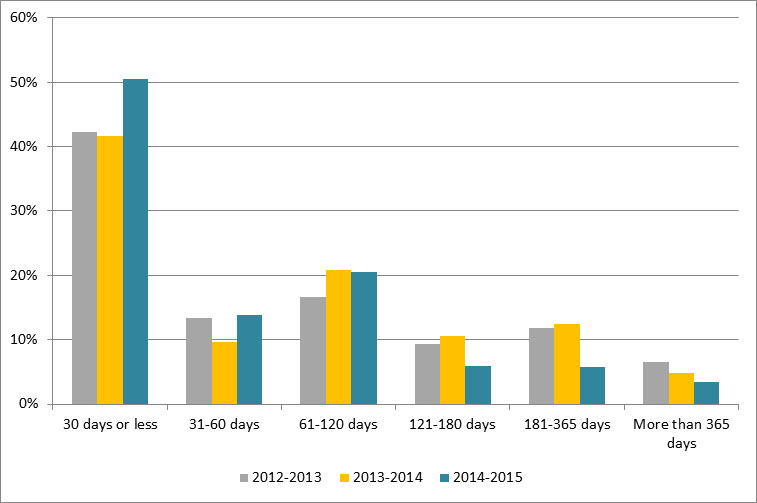
Text version
Figure 1 is a bar chart with vertical bars, representing the completion time by PSPC during each reporting period between 2012-2013 and 2014-2015. The results are as follows:
| Completion time | 2012-2013 | 2013-2014 | 2014-2015 |
|---|---|---|---|
| 30 days or less | 42.31% | 41.67% | 50.55% |
| 31-60 days | 13.41% | 9.66% | 13.88% |
| 61-120 days | 16.61% | 20.77% | 20.44% |
| 121-180 days | 9.35% | 10.63% | 5.93% |
| 181-365 days | 11.81% | 12.44% | 5.77% |
| More than 365 days | 6.52% | 4.83% | 3.43% |
Extensions
PSPC took 372 extensions in 2014-2015 compared to 673 in 2013-2014. The most common reason for taking an extension was to consult (47.0%), followed by third-party notice (34.1%) and interference with operations (18.8%).
Figure 2 shows that 15.3% of extensions were taken for 30 days or less, which represents an increase of 4.3% compared to 2013-2014. Figure 2 demonstrates that the number of extensions taken between 31 and 60 days increased by 2.3% in 2014-2015.
Figure 2: Length of Extensions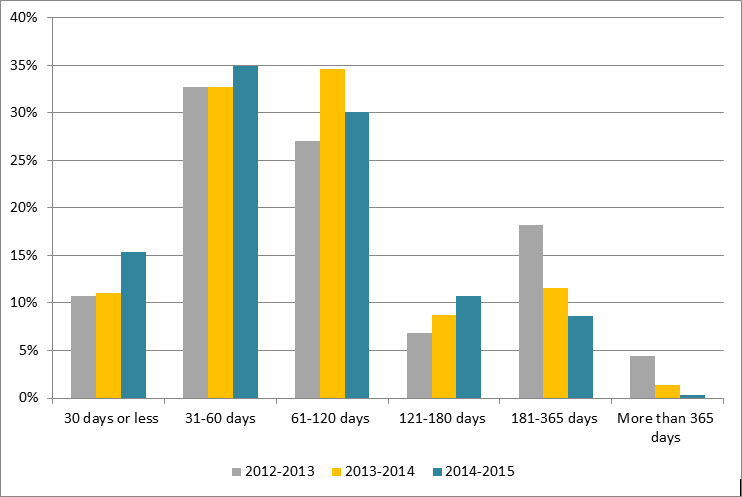
Text version
Figure 2 is a bar chart with vertical bars, representing the length of extensions taken by PSPC during each reporting period between 2012-2013 and 2014-2015. The results are as follows:
| Length of extensions in % | 2012-2013 | 2013-2014 | 2014-2015 |
|---|---|---|---|
| 30 days or less | 10.74% | 11.00% | 15.32% |
| 31-60 days | 32.66% | 32.69% | 34.95% |
| 61-120 days | 27.08% | 34.62% | 30.11% |
| 121-180 days | 6.88% | 8.77% | 10.75% |
| 181-365 days | 18.19% | 11.59% | 8.60% |
| More than 365 days | 4.44% | 1.34% | 0.27% |
Deemed refusals
In 2014-2015, the number of requests closed past the statutory deadline was 31, which accounts for 4.8% of completed requests. This rate represents an “A” grade.Footnote 4 This is a significant improvement in comparison to the “C” obtained in 2013-2014.
Figure 3 shows that 45.2% of the overdue requests were late for more than 365 days which represents a large part of the overdue requests. Two requests were late by 30 days and less compared to the last period where there were 18. The main reasons for the delay were workload (67.7%) and external consultations (22.6%).
Figure 3: Lateness of Overdue Requests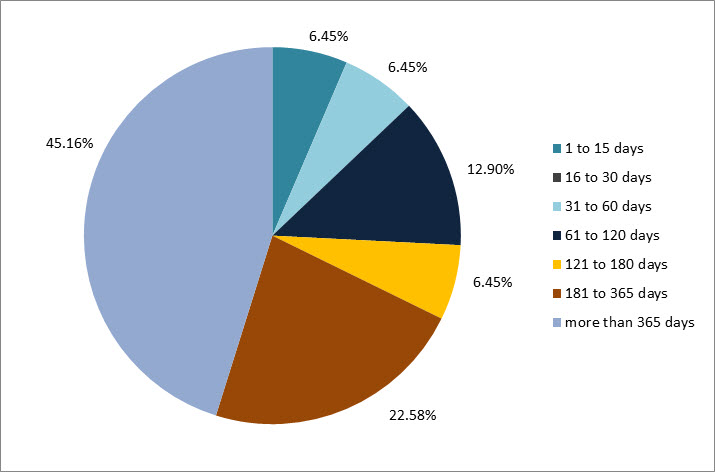
Text version
Figure 3 is a pie chart, representing the delayed days for overdue requests taken by PSPC in 2014-2015. The results are as follows:
| Number of days | 2014-2015 |
|---|---|
| 1 to 15 days | 6.45% |
| 16 to 30 days | 0.00% |
| 31 to 60 days | 6.45% |
| 61 to 120 days | 12.90% |
| 121 to 180 days | 6.45% |
| 181 to 365 days | 22.58% |
| more than 365 days | 45.16% |
| Total | 100.0% |
Disclosure
Percentage of requests for which information was disclosed
In 2014-2015, 20.9% of completed requests were entirely disclosed, which is the highest disclosure rate since 2012 (see Figure 4). Figure 4 also shows that the rate for partially disclosed requests was similar year over year.
Figure 4: Level of Disclosure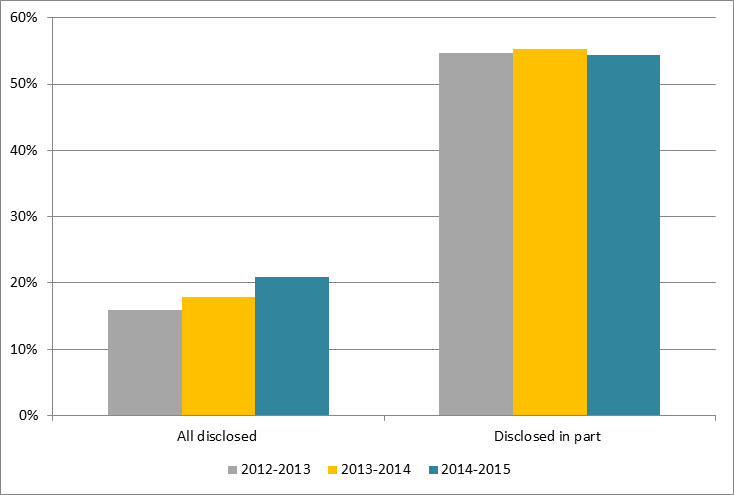
Text version
Figure 4 is a bar-chart with vertical bars, representing the entirely disclosed and disclosed in part requests as proportion of total requests completed by PSPC during each reporting period between 2012-2013 and 2014-2015. The results are as follows:
| Disclosure | 2012-2013 | 2013-2014 | 2014-2015 |
|---|---|---|---|
| All disclosed | 15.87% | 17.87% | 20.90% |
| Disclosed in part | 54.61% | 55.31% | 54.45% |
Exemptions
The average number of exemptions used per completed request decreased from 1.83 in 2013-2014 to 1.52 in 2014-2015 (see Table 2).
The most frequent exemptions in 2014-2015 were section 20 (Third-Party information) (30.4%), followed by section 19 (Personal Information) (26.8%), and section 21 (Operations of Government) (13.9%).
Table 2: Exemptions
| Exemptions | 2012-2013 | 2013-2014 | 2014-2015 |
|---|---|---|---|
| Total number of exemptions | 1,468 | 1,514 | 974 |
| Total number of completed requests | 813 | 828 | 641 |
| Average number of exemptions per request | 1.81 | 1.83 | 1.52 |
Complaints
In 2014-2015, 26 complaintsFootnote 5 were received against PSPC compared to 28 in 2013-2014. 16 complaints were refusals and 10 complaints were administrative. The number of well-founded complaints dropped from 12 to 6 in 2014-2015.
In 2014-2015, discontinued and pending complaints were 6 and 7 respectively.
Footnotes
- Footnote 1
-
PWGSC was changed to Public Services and Procurement Canada.
- Footnote 2
-
Overall performance is based on two primary indicators: % of requests completed within 30 days, % of requests that were fully disclosed.
- Footnote 3
-
The completion rate was calculated using the number of received requests during the reporting period as well as outstanding requests from the previous period.
- Footnote 4
-
The 2007-2008 OIC report card grading system was used to estimate the grade A= 0 to 5%; B= 5 to 10%; C=10 to 15%, D= 15 to 20%, F=20% and more.
- Footnote 5
-
The numbers reported in this section are based on the OIC’s statistics. The information may not reflect the statistics reported by institutions due to the discrepancies in the methodology used.