2014-2015 Library and Archives Canada
Overall performanceFootnote 1
In 2014-2015, despite receiving a similar number of requests, Library and Archives Canada (LAC) improved its proportion of requests completed within 30 day by 9.9% compared to the previous year. This report provides comparative statistics for the last three periods (2012-2015).
Workload
LAC received 829 requests under the Access to Information Act (the Act), representing 1.2% of total requests across government in 2014-2015. This similar to the last reporting period, during which 877 requests were received by LAC. The majority of requests received in 2014-2015 were from the public (85.3%), which is an increase of 12.4% from the previous period.
LAC completed 821 requests this reporting period. The completion rateFootnote 2 was 86.9%, which is higher than the government-wide rate of 85.1%. In 2013-2014, LAC’s completion rate was 88.8%. LAC also received 6,671 informal requests and 39.6% of these were completed within 30 days. The number of consultations received by LAC from other federal government institutions increased from 28 in 2013-2014 to 33.
The total number of pages processed this reporting period was 276,887. Table 1 shows that the average number of pages processed per completed request decreased from 449 pages in 2013-2014 to 367 in 2014-2015.
Information released by LAC was almost equally distributed in paper and electronic format: 342 and 327 requests respectively.
Table 1. Workload
| Measures | 2012-2013 | 2013-2014 | 2014-2015 |
|---|---|---|---|
| Number of requests received | 900 | 877 | 829 |
| Annual change (%) | - | -2.6% | -5.5% |
| Completed requests | 874 | 924 | 821 |
| Annual change | - | 5.7% | -11.1% |
| Number of consultations received (from other government institutions) | 41 | 28 | 33 |
| Annual change (%) | - | -31.7% | 17.9% |
| Average number of pages processed per request completed | 652 | 449 | 367 |
| % of requests for which more than 1,000 pages were processed | 18.0% | 11.8% | 9.7% |
Request completion time
Timeliness
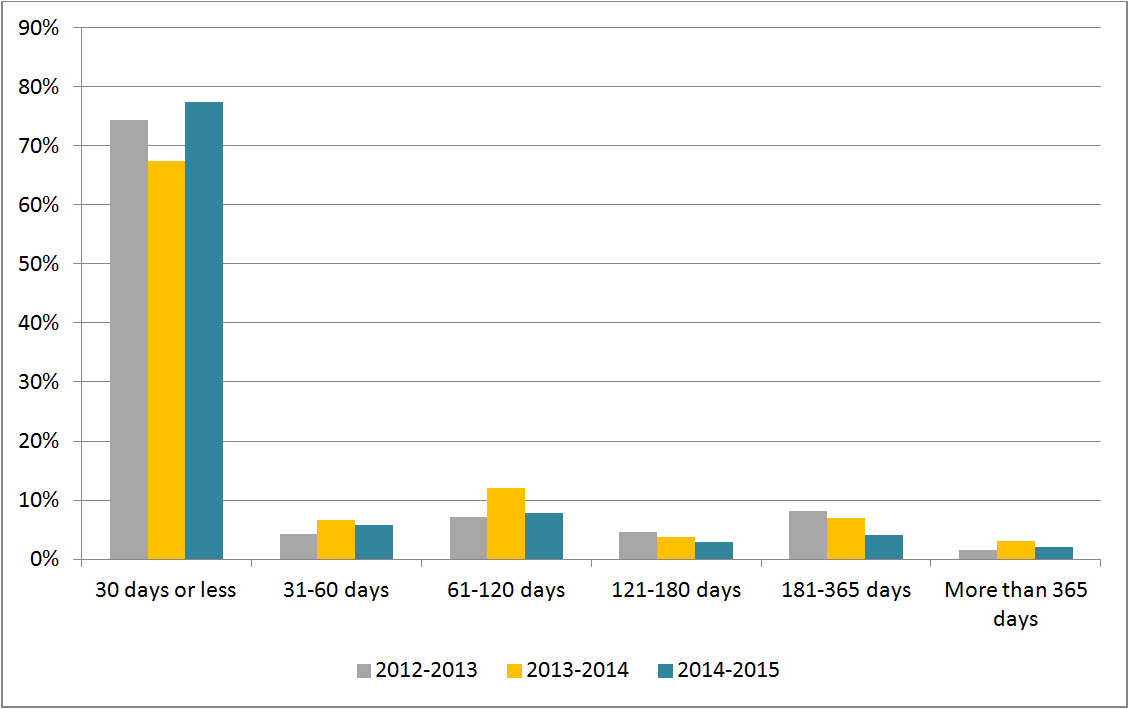
Figure 1 reveals that 77.3% of requests were completed within 30 days or less. This is 9.9% higher than the results observed in 2013-2014.
Figure 1: Request Completion Time
Text version
Figure 1 is a bar chart with vertical bars, representing the completion time by LAC during each reporting period between 2012-2013 and 2014-2015. The results are as follows:
| Completion time | 2012-2013 | 2013-2014 | 2014-2015 |
|---|---|---|---|
| 30 days or less | 74.37% | 67.46% | 77.34% |
| 31-60 days | 4.23% | 6.70% | 5.85% |
| 61-120 days | 7.21% | 12.11% | 7.80% |
| 121-180 days | 4.58% | 3.79% | 2.92% |
| 181-365 days | 8.12% | 6.92% | 4.02% |
| More than 365 days | 1.49% | 3.03% | 2.07% |
Extensions
LAC took a total of 187 extensions in 2014-2015 compared to 356 in 2013-2014. The most common reason for taking an extension was consultations (84.5%).
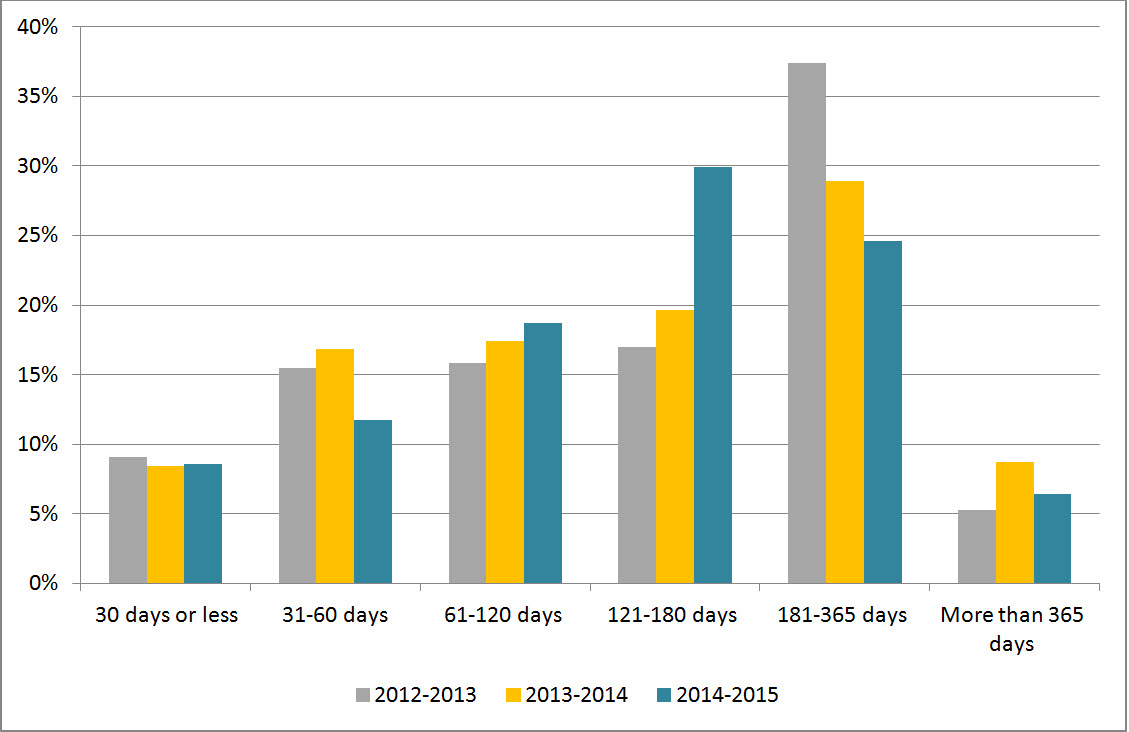
Figure 2 shows that 8.6% of extensions were taken for less than 30 days, which is similar to the results in the previous year. We also observed that the number of extensions taken between 31 and 60 days in 2014-2015 decreased by 5.1% compared to 2013-2014. Extensions taken between 121 and 180 days increased by 10.3% in 2014-2015.
Figure 2: Length of Extensions
Text version
Figure 2 is a bar chart with vertical bars, representing the length of extensions taken by LAC during each reporting period between 2012-2013 and 2014-2015. The results are as follows:
| Length of extensions | 2012-2013 | 2013-2014 | 2014-2015 |
|---|---|---|---|
| 30 days or less | 9.06% | 8.43% | 8.56% |
| 31-60 days | 15.47% | 16.85% | 11.76% |
| 61-120 days | 15.85% | 17.42% | 18.72% |
| 121-180 days | 16.98% | 19.66% | 29.95% |
| 181-365 days | 37.36% | 28.93% | 24.60% |
| More than 365 days | 5.28% | 8.71% | 6.42% |
Deemed refusals
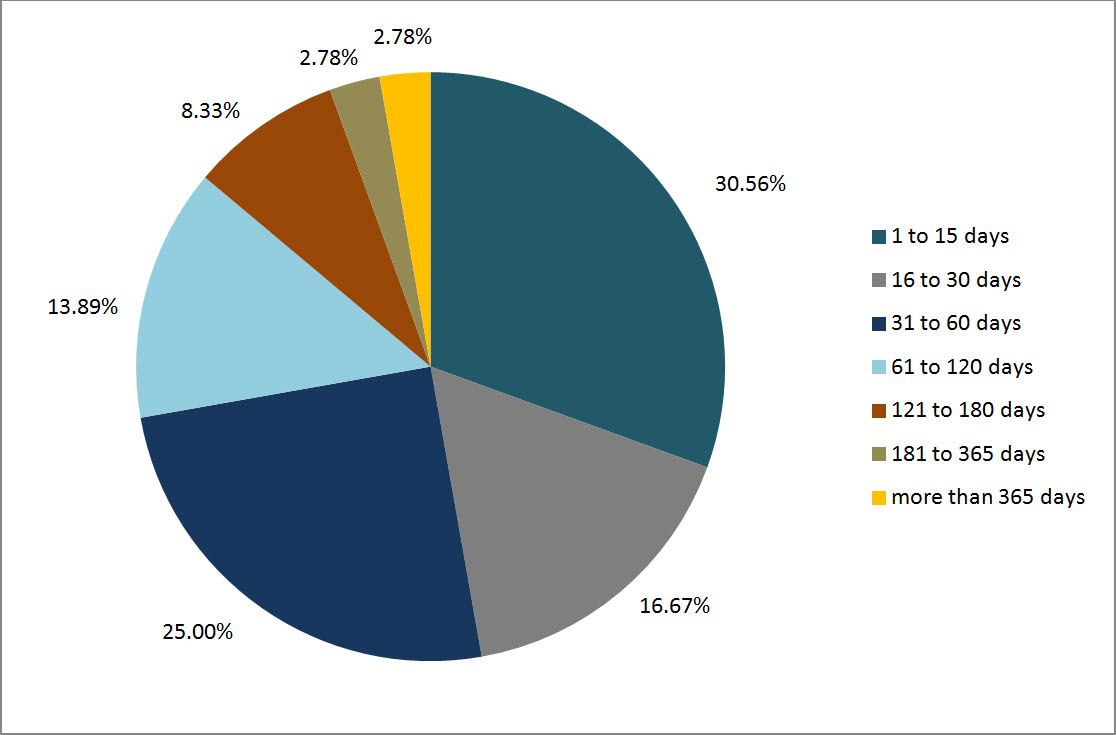
In 2014-2015, the number of requests closed past the statutory deadline was 36 which accounts for 4.4% of completed requests. This rate represents an “A” grade.Footnotee 3 The most common reason for overdue requests was external consultations (33.3%) and other reasons (44.4%). Figure 3 shows that 47.2% of overdue requests were late for 30 days or less.
Figure 3: Lateness of Overdue Requests
Text version
Figure 3 is a pie chart, representing the delayed days for overdue requests taken by LAC in 2014-2015. The results are as follows:
| Number of days | 2014-2015 |
|---|---|
| 1 to 15 days | 30.56% |
| 16 to 30 days | 16.67% |
| 31 to 60 days | 25.00% |
| 61 to 120 days | 13.89% |
| 121 to 180 days | 8.33% |
| 181 to 365 days | 2.78% |
| More than 365 days | 2.78% |
| Total | 100.0% |
Disclosure
Percentage of requests for which information was disclosed
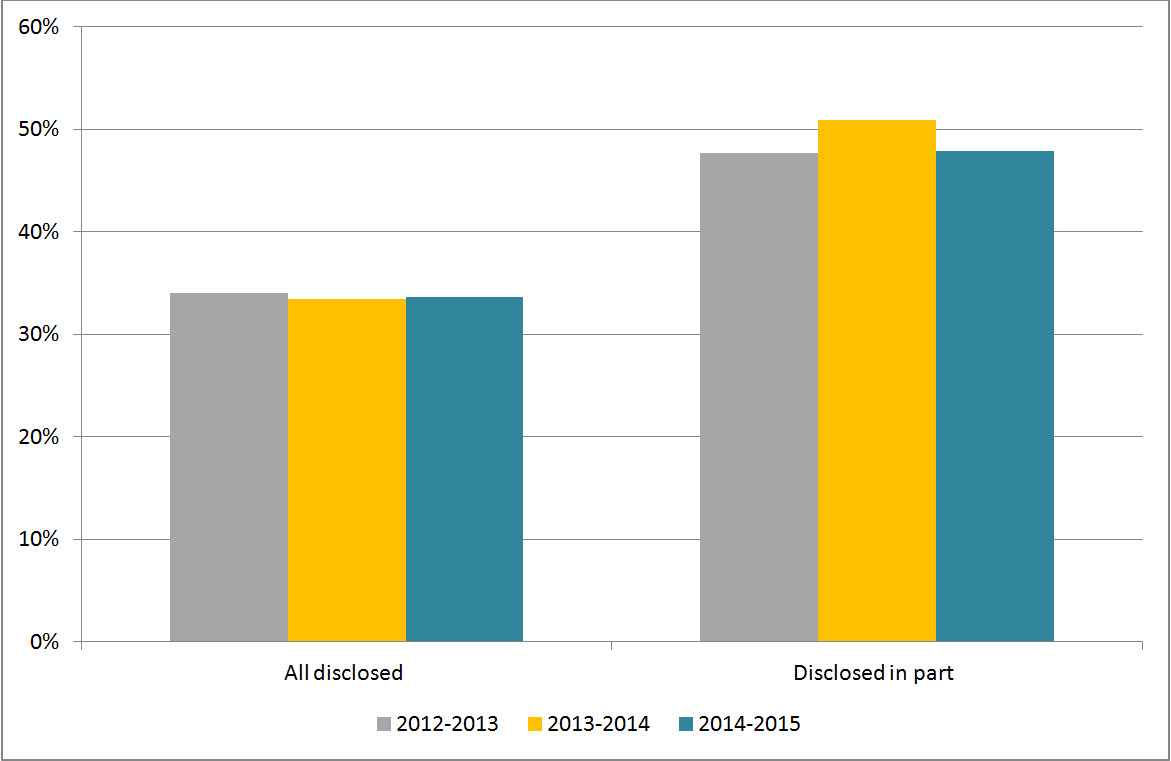
In 2014-2015, 33.6% of completed requests were entirely disclosed, which is similar to the previous period (see Figure 4). Figure 4 also shows that the rate for partially disclosed requests was 47.9% in 2014-2015, which represents a 3.1% decrease from the results of the previous period.
Figure 4: Level of Disclosure
Text version
Figure 4 is a bar-chart with vertical bars, representing the entirely disclosed and disclosed in part requests as proportion of total requests completed by LAC during each reporting period between 2012-2013 and 2014-2015. The results are as follows:
| Disclosure | 2012-2013 | 2013-2014 | 2014-2015 |
|---|---|---|---|
| All disclosed | 33.98% | 33.44% | 33.62% |
| Disclosed in part | 47.71% | 50.92% | 47.87% |
Exemptions
In 2014-2015, LAC applied 530 exemptions compared to 591 in the previous year. The average number of exemptions used per completed request was similar to the one observed in the previous period (0.64 in 2013-2014 and 0.65 2014-2015) (see Table 2).
The most common exemptions used in 2014-2015 were section 19 (Personal Information) (63.4%), followed by section 13 (Information Obtained in Confidence) (12.5%). The number of exemptions applied for section 13 provisions decreased by 3.1%, whereas the number of exemptions under section 19 increased by 3.9% from the previous period.
Table 2: Exemptions
| Exemptions | 2012-2013 | 2013-2014 | 2014-2015 |
|---|---|---|---|
| Total number of exemptions | 533 | 591 | 530 |
| Total number of completed requests | 874 | 924 | 821 |
| Average number of exemptions per completed request | 0.61 | 0.64 | 0.65 |
Complaints at the OIC
In 2014-2015, the OIC received 9 complaintsFootnote 4 against LAC, which is a slight decline from 13 the previous period. There were 5 refusal and 4 administrative complaints. Three complaints were well-founded, while 2 were not well-founded, 1 was discontinued and 3 were pending resolution.
Footnotes
- Footnote 1
-
Overall performance is based on two primary indicators: % of requests completed within 30 days, % of requests that were fully disclosed.
- Footnote 2
-
The completion rate was calculated using the number of received requests during the reporting period as well as outstanding requests from the previous period.
- Footnote 3
-
The 2007-2008 OIC report card grading system was used to estimate the grade A= 0 to 5%; B= 5 to 10%; C=10 to 15%, D= 15 to 20%, F=20% and more.
- Footnote 4
-
The numbers reported in this section are based on the OIC’s statistics. The information may not reflect the statistics reported by institutions due to the discrepancies in the methodology used.