2014-2015 Immigration, Refugees and Citizenship Canada
Overall performanceFootnote 1
Immigration, Refugees and Citizenship Canada (IRCC)Note de bas de page 2 showed a similar performance as the previous year despite an increase of 16.3% in requests received. This report provides comparative statistics for the last three periods (2012-2015).
Workload
IRCC received by far the highest number of requests (36,066) under the Access to Information Act (the Act), representing 50.0% of total requests received across government in 2014-2015. It is also an increase of 16.3% compared to the 29,281requests received in 2013-2014. The majority of requests were from the business sector (52.3%), followed by the public (36.5%).
IRCC completed 33,524 requests during this reporting period. The completion rateNote de bas de page 3 was 90.2%, which is higher than the government-wide rate, which was 85.1%. In 2013-2014, the completion rate for IRCC was 89.8%. IRCC also received 899 informal requests in 2014-2015 and 43.8% of these were completed within 30 days. The number of consultations received by IRCC from other federal government institutions increased from 178 to 222, an increase of 24.7%.
In 2014-2015, IRCC processed 1,615,772 pages, representing an increase of 30.2% in comparison to the previous period. The average number of pages processed per completed request increased marginally from 48 in 2013-2014 to 50 in 2014-2015.
The information released by IRCC was mostly in electronic format: 29,164 requests in electronic format and 979 requests in paper format. This represents a significant reduction of 48.6% in the number of requests disclosed in paper format compared to the previous year where they had 1,906.
Table 1. Workload
| Measures | 2012-2013 | 2013-2014 | 2014-2015 |
|---|---|---|---|
| Number of requests received | 25,010 | 29,281 | 34,066 |
| Annual change (%) | - | 17.1% | 16.3% |
| Completed requests | 26,020 | 27,407 | 33,524 |
| Annual change (%) | - | 5.3% | 22.3% |
| Number of consultations received (from other government institutions) | 188 | 178 | 222 |
| Annual change (%) | - | -5.3% | 24.7% |
| Average number of pages processed per request completed | 59 | 48 | 50 |
| % of requests for which more than 1,000 pages were processed | 0.3% | 0.2% | 0.2% |
Request completion time
Timeliness
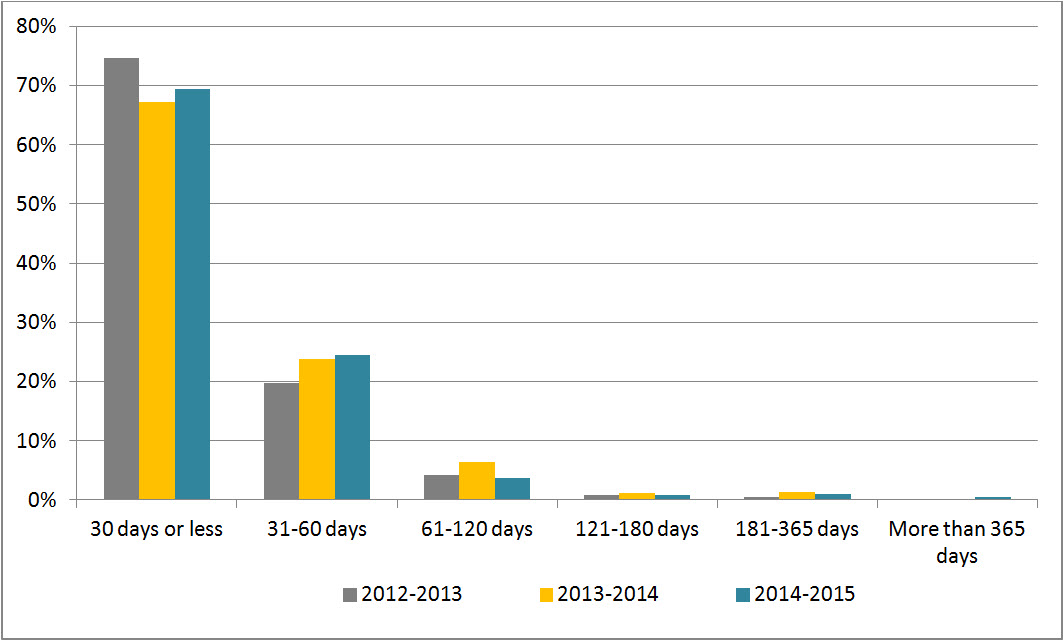
Figure 1 reveals that 69.3% of requests were completed within 30 days or less, which is higher than the results observed in 2013-2014 (67.2%). The percentage of requests completed between 61 and 120 days decreased by 3.7% from the previous period.
Figure 1: Request Completion Time
Text version
Figure 1 is a bar chart with vertical bars, representing the completion time by IRCC during each reporting period between 2012-2013 and 2014-2015. The results are as follows:
| Completion time | 2012-2013 | 2013-2014 | 2014-2015 |
|---|---|---|---|
| 30 days or less | 74.62% | 67.20% | 69.33% |
| 31-60 days | 19.76% | 23.72% | 24.51% |
| 61-120 days | 4.25% | 6.40% | 3.73% |
| 121-180 days | 0.90% | 1.25% | 0.84% |
| 181-365 days | 0.43% | 1.31% | 1.08% |
| More than 365 days | 0.03% | 0.12% | 0.51% |
Extensions
IRCC took a total of 1,465 extensions in 2014-2015 compared to 1,531 in 2013-2014. The most common reason for taking an extension was interference with operations, for which 60.3% of the total extensions were claimed, followed by 37.7% for consultations, and 2.0% for third-party notice.
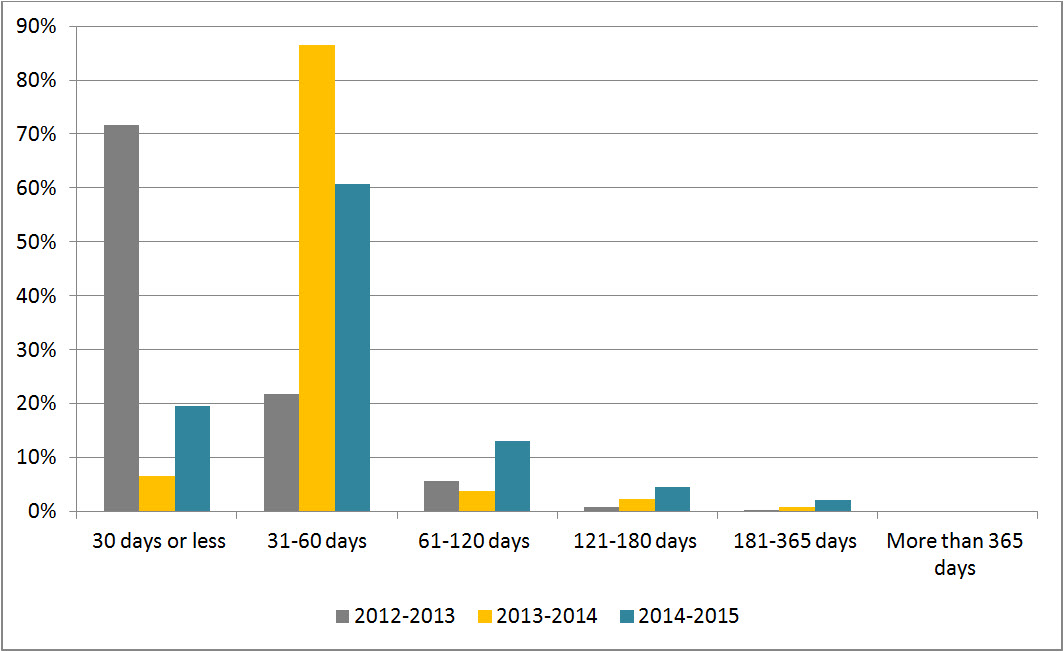
Figure 2 shows that 19.6% of the extensions taken in 2014-2015 were for 30 days or less, which is higher than the previous year. However, when compared to 2012-2013, the proportion of extensions taken for less than 30 days dropped significantly in 2013-2014. The proportion of extensions of 31 to 60 days decreased from 86.4% in 2013-2014 to 60.7% in 2014-2015.
Figure 2: Length of Extensions
Text version
Figure 2 is a bar chart with vertical bars, representing the length of extensions taken by IRCC during each reporting period between 2012-2013 and 2014-2015. The results are as follows:
| Length of extensions | 2012-2013 | 2013-2014 | 2014-2015 |
|---|---|---|---|
| 30 days or less | 71.62% | 6.60% | 19.60% |
| 31-60 days | 21.75% | 86.41% | 60.68% |
| 61-120 days | 5.69% | 3.85% | 13.04% |
| 121-180 days | 0.79% | 2.35% | 4.57% |
| 181-365 days | 0.16% | 0.78% | 2.12% |
| More than 365 days | 0.00% | 0.00% | 0.00% |
Deemed refusals
In 2014-2015, the number of requests closed past the statutory deadline was 3,706, which accounts for 11.1% of all completed requests. This rate represents a “C” grade.Note de bas de page 4 Workload was invoked as the principal reason for overdue requests (for 97.9% of requests closed past the statutory federal deadline).
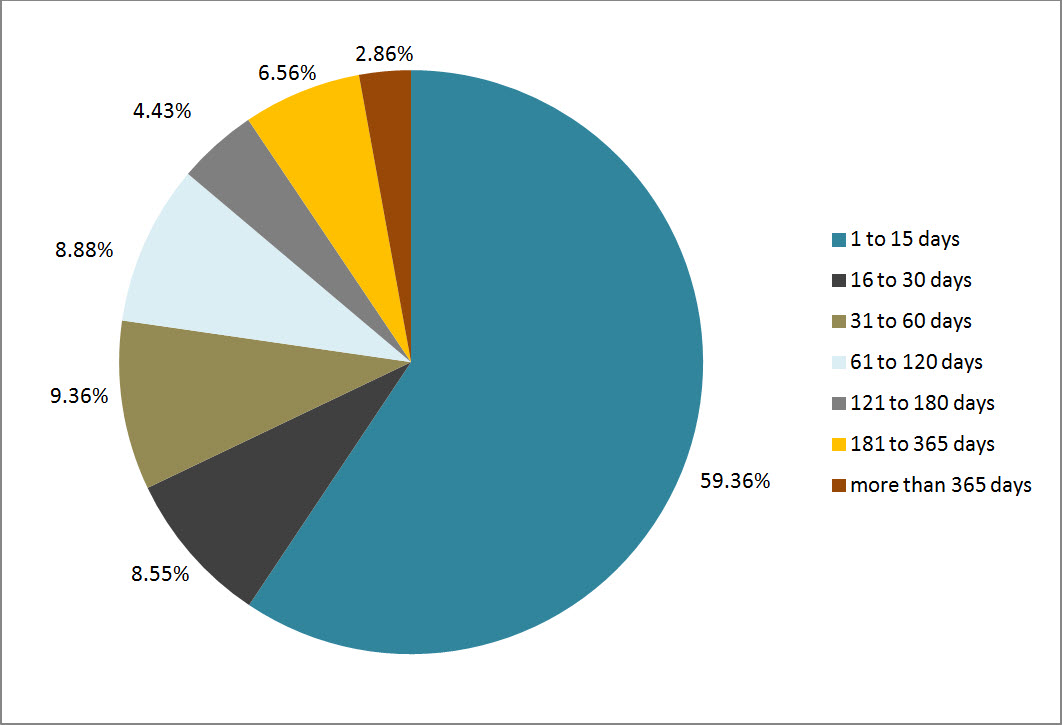
Figure 3 shows that 59.4% of overdue requests were late by 15 days or less, 8.6% of requests were late between 16 and 30 days and 8.9% were late between 61 and 120 days. 2.9% of overdue requests took more than 365 days to complete. In 2013-2014, 53.3% of overdue requests were responded within 15 days.
Figure 3: Lateness of Overdue Requests
Text version
Figure 3 is a pie chart, representing the delayed days for overdue requests taken by IRCC in 2014-2015. The results are as follows:
| Number of days | 2014-2015 |
|---|---|
| 1 to 15 days | 59.36% |
| 16 to 30 days | 8.55% |
| 31 to 60 days | 9.36% |
| 61 to 120 days | 8.88% |
| 121 to 180 days | 4.43% |
| 181 to 365 days | 6.56% |
| More than 365 days | 2.86% |
| Total | 100.0% |
Disclosure
Percentage of requests for which information was disclosed
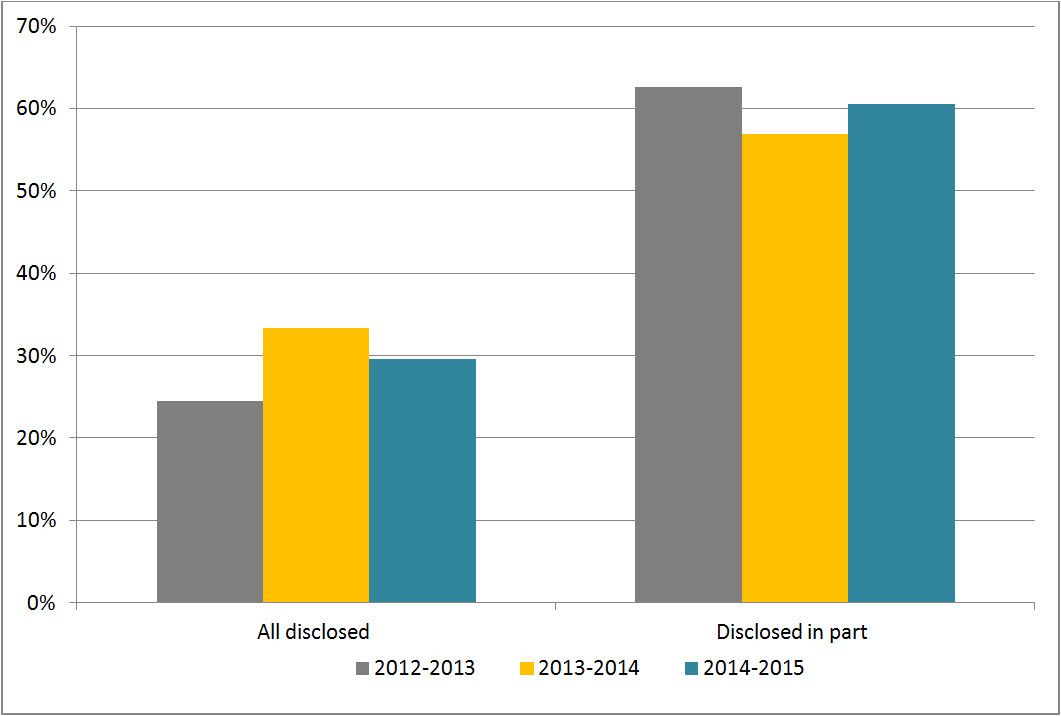
In 2014-2015, 30.8% of completed requests were entirely disclosed. This is lower than the previous period’s rate of full disclosure (33.4%) (see Figure 4). The rate for partially disclosed requests was 62.9% in 2014-2015 and 5.6% of requests were abandoned, representing 1,893 requests.
Figure 4: Level of Disclosure
Text version
Figure 4 is a bar-chart with vertical bars, representing the entirely disclosed and disclosed in part requests as proportion of total requests completed by IRCC during each reporting period between 2012-2013 and 2014-2015. The results are as follows:
| Disclosure | 2012-2013 | 2013-2014 | 2014-2015 |
|---|---|---|---|
| All disclosed | 24.52% | 33.36% | 29.58% |
| Disclosed in part | 62.64% | 56.92% | 60.50% |
Exemptions
The average number of exemptions used per completed request increased slightly from 0.81 in 2013-2014 to 0.89 in 2014-2015 (see Table 2). The most used exemptions in 2014-2015 were section 19 (Personal Information) (48.6%), and section 15 (International Affairs and Defence) (29.8%), followed by section 16 (Law Enforcement and Investigations) (14.2%).
Table 2: Exemptions
| Exemptions | 2012-2013 | 2013-2014 | 2014-2015 |
|---|---|---|---|
| Total number of exemptions | 22,916 | 22,062 | 29,996 |
| Total number of completed requests | 26,020 | 27,407 | 33,524 |
| Average number of exemptions per completed request | 0.88 | 0.81 | 0.89 |
Complaints at the OIC
The number of complaints received by the OICNote de bas de page 5 in 2014-2015 against IRCC was 246, which is less compared to the 305 complaints received by our office in 2013-2014. Around 45% of complaints were refusals. Almost 51% of complaints received this reporting period were well-founded and resolved, while 14% were not well-founded. In addition, 26 complaints were discontinued and 31 were pending resolution.
Footnotes
- Footnote 1
-
Overall performance is based on two primary indicators: % of requests completed within 30 days and % of requests that were fully disclosed.
- Footnote 2
-
The name of Citizenship and Immigration Canada was changed to Immigration, Refugee and Citizenship Canada.
- Footnote 3
-
The completion rate was calculated using the number of received requests during the reporting period as well as outstanding requests from the previous period.
- Footnote 4
-
The 2007-2008 OIC report card grading system was used to estimate the grade A= 0 to 5%; B= 5 to 10%; C=10 to 15%, D= 15 to 20%, F=20% and more.
- Footnote 5
-
The numbers reported in this section are based on the OIC’s statistics. The information may not reflect the statistics reported by institutions due to the discrepancies in the methodology used.