2013-2014 Industry Canada
Industry Canada’s (IC) mandate is to help make Canada’s industry more productive and competitive in the global economy, thus improving the economic and social well-being of Canadians.
In 2013–2014, IC received 857 requests,Footnote 1 an increase of 15.7%Footnote 2 from 2012–2013 (741 requests). While IC received 15% more requests in 2013–2014, the number of consultations received from other government institutions decreased during the same time frame, from 770 in 2012–2013 to 252 in 2013–2014. Overall, IC’s performance was weaker on two key indicators.Footnote 3
Of a total of 958 active requests, 865 requests were completed during 2013–2014, a completion rate of 90.3% (compared to 89.5% in 2012–2013).
The majority of requests were from the media (62%). This represents an important increase compared to the 2013–2014 reporting period, where 39% of the requestors were members of the media. Other significant sources of requests this year included members of the public (14%) and businesses (13%).
Table 1. Workload
| Measures | Reporting Period 2012–2013 | Reporting Period 2013–2014 | Difference |
|---|---|---|---|
| Number of requests received | 741 | 857 | 15.65% |
| Number of consultations received (from other government institutions) | 770 | 252 | -67.27% |
| Average number of pages processed per request completed | 5,050 | 9,631 | 4,581 |
| % of requests for which more than 1,000 pages were processed | 13.39% | 4.44% | -8.95% |
| Note: The average number of pages processed per request completed and the percentage of requests for which more than 1,000 pages were processed are calculated from the total of requests completed for which the information was disclosed (in part or totally), exempted/excluded and for requests abandoned. It excludes requests completed for the following dispositions: no records exist, requests transferred and requests treated informally. | |||
Compared to government-wide statistics, IC processed by far the highest number of pages per request in 2013–2014 (9,631 pages/request completed compared to 5,050 pages/request completed in 2012–2013). The government-wide average was 258 pages per request in 2013–2014. However, the high volume of pages processed (5.2 million) was attributed to a small number of requests, as 5,000,000 of the pages processed were related to only 17 requests. As such, most of the requests completed required the processing of less than 100 pages (79.6%).
Timeliness
IC responded to 519 requests within 30 days or less, which represents about 60% of the requests it completed in 2013–2014. This rate also represents a decrease compared to 2012–2013 (64.2%). The proportion of requests completed in more than 120 days also went down from 17.8% in 2012–2013 to 14.6% in 2013–2014.
The proportion of requests closed past the statutory deadline in 2013–2014 was 5.32%. This represents a “B” grade,Footnote 4 which is a significant improvement compared to the deemed refusal rate achieved in 2012–2013 (15.1%). The vast majority of these late requests had been extended.
Workload was reported as the principal reason why statutory deadlines could not be met, representing about 65% of the 46 requests closed past statutory or extended deadlines in 2013–2014.
Extensions
A total of 466 extensions were taken in 2013–2014, an average of 0.54 extension per request completed. In comparison, this proportion was 0.34 during the last reporting period. This means that IC took proportionally significantly more extensions to complete requests in 2013–2014 than in 2012–2013.
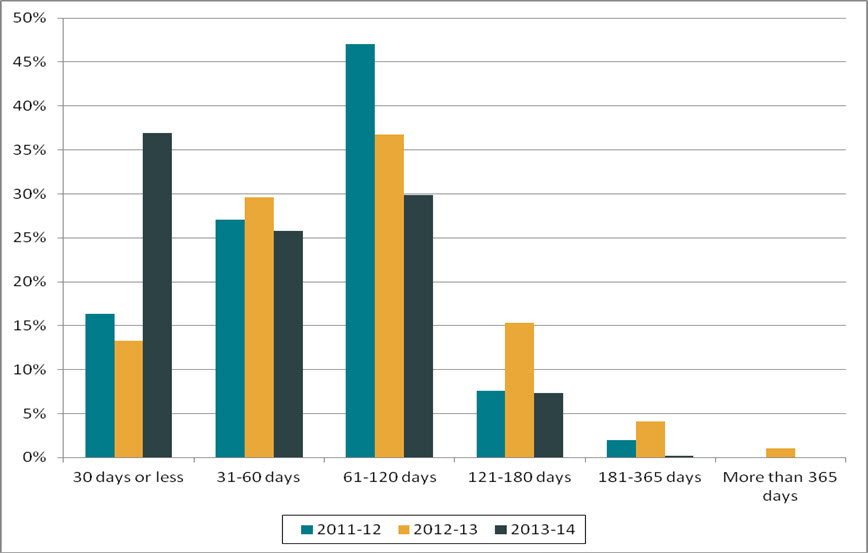
In 2013–2014, 36.9% of extensions were for a period not exceeding 30 days, a significant increase from 2012–2013.
Figure 1. Length of extensions (2011–2012 to 2013–2014)
Text version
Figure 1 is a bar chart with vertical bars, representing the length of extensions taken by IC during each reporting period between 2011–2012 and 2013–2014. The results are as follows:
| Reporting period | 30 days or less | 31-60 days | 61-120 days | 121-180 days | 181-365 days | More than 365 days |
|---|---|---|---|---|---|---|
| 2011–2012 | 16.33% | 27.09% | 47.01% | 7.57% | 1.99% | 0.00% |
| 2012–2013 | 13.27% | 29.59% | 36.73% | 15.31% | 4.08% | 1.02% |
| 2013–2014 | 36.91% | 25.75% | 29.83% | 7.30% | 0.21% | 0.00% |
Lastly, the majority of the extensions taken in 2013–2014 were for consultations under section 9(1)(b) (57%). These extensions also tended to be for longer periods (63% for more than 60 days) than those taken under paragraph 9(1)(a), where 85% were for 30 days or less. Finally, 96% of the extensions under section 9(1)(c) were for 60 days or less.
Disclosure
Of the 865 requests completed in 2012–2013, 7.3% were disclosed entirely, which represents a 3% decrease compared to 2012–2013.
Only 1.63% of the 5.2 million pages processed were disclosed. According to IC, this low proportion is due to the entire exemption of more than 5 million pages processed in accordance with IC’s statutory obligations under the Competition Act and the Investment Canada Act.
Exemptions/Exclusions
In 2013–2014, a total of 1,011 exemptions and 193 exclusions were applied, representing about 1.39 exemptions/exclusions per request completed. In comparison, this proportion was 1.97 in 2012–2013.
Frequently applied exemptions in 2013–2014 included: operations of government (483), third party information (248) and personal information (108).
Table 2. Performance
| Measures | Reporting Period 2012–2013 |
Reporting Period 2013–2014 |
Difference | |
|---|---|---|---|---|
| Completion of Requests | ||||
| Completion rate | 89.49% | 90.29% | 0.8% | |
| Completion Time | ||||
| % of requests completed within 30 days | 64.19% | 60.00% | -4.19% | |
| Average number of days to complete a request | 127 | N/A | N/A | |
| % of requests closed past statutory or extended deadline | 15.12% | 5.32% | -9.80% | |
| % of consultations from government institution completed within 30 days | 28.73% | 54.57% | 25.84% | |
| % of extensions of 30 days or less | 13.27% | 36.91% | 23.64% | |
| Level of Disclosure | ||||
| % of pages processed that were disclosed | 3.69% | 1.63% | -2.06% | |
| % of requests completed for which the information was disclosed entirely | 10.35% | 7.28% | -3.07% | |
| % of pages disclosed entirely | 9.69% | 20.86% | 11.17% | |
| Exemptions/Exclusions | ||||
| Number of exemptions/exclusions per request completed | 1.97 | 1.39 | -0.58 | |
Other activities
The IC’s ATIP team reviewed its practices in order to streamline processes and improve the overall administration of the access to information requests received under the Act. According to the annual report, this process allowed IC to identify and eliminate redundant elements, which would expectedly have a positive impact on IC’s performance.
Complaints
In 2013–2014, the number of complaints received against ICFootnote 5 increased from 36 complaints in 2012–2013 to 42 in 2013–2014 (16.7%).
Most of the complaints (36) received were for refusal (85.7%). This is similar to the proportion of refusal complaints received in 2012–2013 (88.9%).
As for the disposition of the complaints received in 2013–2014, 10 of them were discontinued, 9 were well founded, 3 settled and 2 not well-founded. The remaining 18 complaints were still pending as of April 2015.
Footnotes
- Footnote 1
-
A review of the summaries of completed ATI requests online via the www.open.canada.ca website revealed that themes of requested information included: information regarding the wireless industry (Rogers, Videotron, Verizon and other companies), documents prepared for the new minister following the July Cabinet shuffle, briefing notes on meetings with various companies, and information on General Motors of Canada Limited.
- Footnote 2
-
This increase seems to be the result of the inclusion of informal requests for previously released information in the calculation of the total number of access requests received in 2013–2014 under “treated informally” (as per table in the statistical report, IC received 235 such requests). Based on the TBS’s guide, requests that are treated informally are formal requests that have been discontinued for an informal treatment. The inclusion of these requests in the calculation impacts the overall performance indicators of the institution.
- Footnote 3
-
Percentage of requests completed in 30 days and percentage of requests all disclosed.
- Footnote 4
-
The 2007–2008 OIC report card grading system was used to estimate the grade: A=0 to 5%, B=5 to 10%, C=10 to 15%, D=15 to 20%, F=more than 20%.
- Footnote 5
-
The numbers reported in this section are based on the OIC’s statistics. The information may not reflect the statistics reported by institutions due to the discrepancies in the methodology used.