2015-2016 Appendix A: Facts and figures
Summary of caseload, 2011–2012 to 2015–2016
| 2011–2012 | 2012–2013 | 2013–2014 | 2014–2015 | 2015–2016 | |
|---|---|---|---|---|---|
| Complaints carried over from previous year |
1,853 |
1,823 |
1,798 |
2,090 |
2,234 |
| New complaints received |
1,460 |
1,579 |
2,069 |
1,738 |
2,036 |
| New Commissioner-initiated complaintsFootnote 1 |
5 |
17 |
12 |
11 |
11 |
| Total new complaints |
1,465 |
1,596 |
2,081 |
1,749 |
2,047 |
| Complaints discontinued during the year |
641 |
399 |
551 |
416 |
353 |
| Complaints settled during the year |
34 |
172 |
193 |
276 |
71 |
| Complaints resolved during the yearFootnote 2 |
- |
- |
- |
- |
67 |
| Complaints completed during the year with finding |
820 |
1,050 |
1,045 |
913 |
790 |
| Total complaints closed during the year |
1,495 |
1,621 |
1,789 |
1,605 |
1,281 |
| Total inventory of complaints at year-end |
1,823 |
1,798 |
2,090 |
2,234 |
3,000 |
| Total new written inquiriesFootnote 3 |
208 |
258 |
248 |
431 |
448 |
| Total written inquiries closed during the year |
186 |
263 |
236 |
235 |
633 |
Complaints registered, 2012–2013 to 2015–2016
Text Version
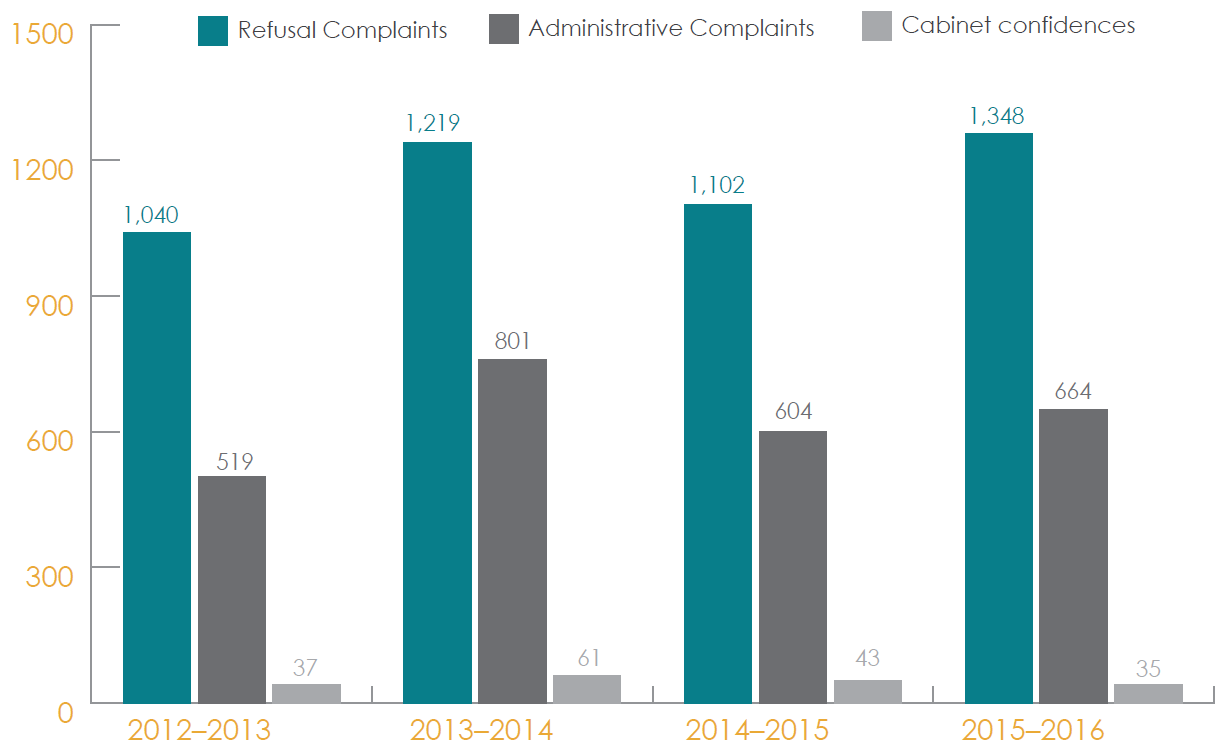
The figure is a vertical bar chart showing the number of complaints the Commissioner registered from 2012–2013 to 2015–2016. There are three categories of complaints for each year: refusal complaints, administrative complaints and complaints related to Cabinet Confidences exclusions.
In 2012–2013, the Commissioner received 1,040 refusal complaints, 519 administrative complaints and 37 Cabinet confidences complaints.
In 2013–2014, the Commissioner received 1,219 refusal complaints, 801 administrative complaints and 61 Cabinet confidences complaints.
In 2014–2015, the Commissioner received 1,102 refusal complaints, 604 administrative complaints and 43 Cabinet confidences complaints.
In 2015–2016, the Commissioner received 1,348 refusal complaints, 664 administrative complaints and 35 Cabinet confidences complaints.
In 2015–2016 the Commissioner received 664 administrative complaints (about delays, time extensions and fees), 35 Cabinet confidence refusal complaints and 1,348 refusal complaints (commonly about the application of exemptions).
The ratio of administrative complaints to refusal complaints registered was 32:68.
Commonly cited exemptions in exemption complaints registered, 2015–2016
Text Version
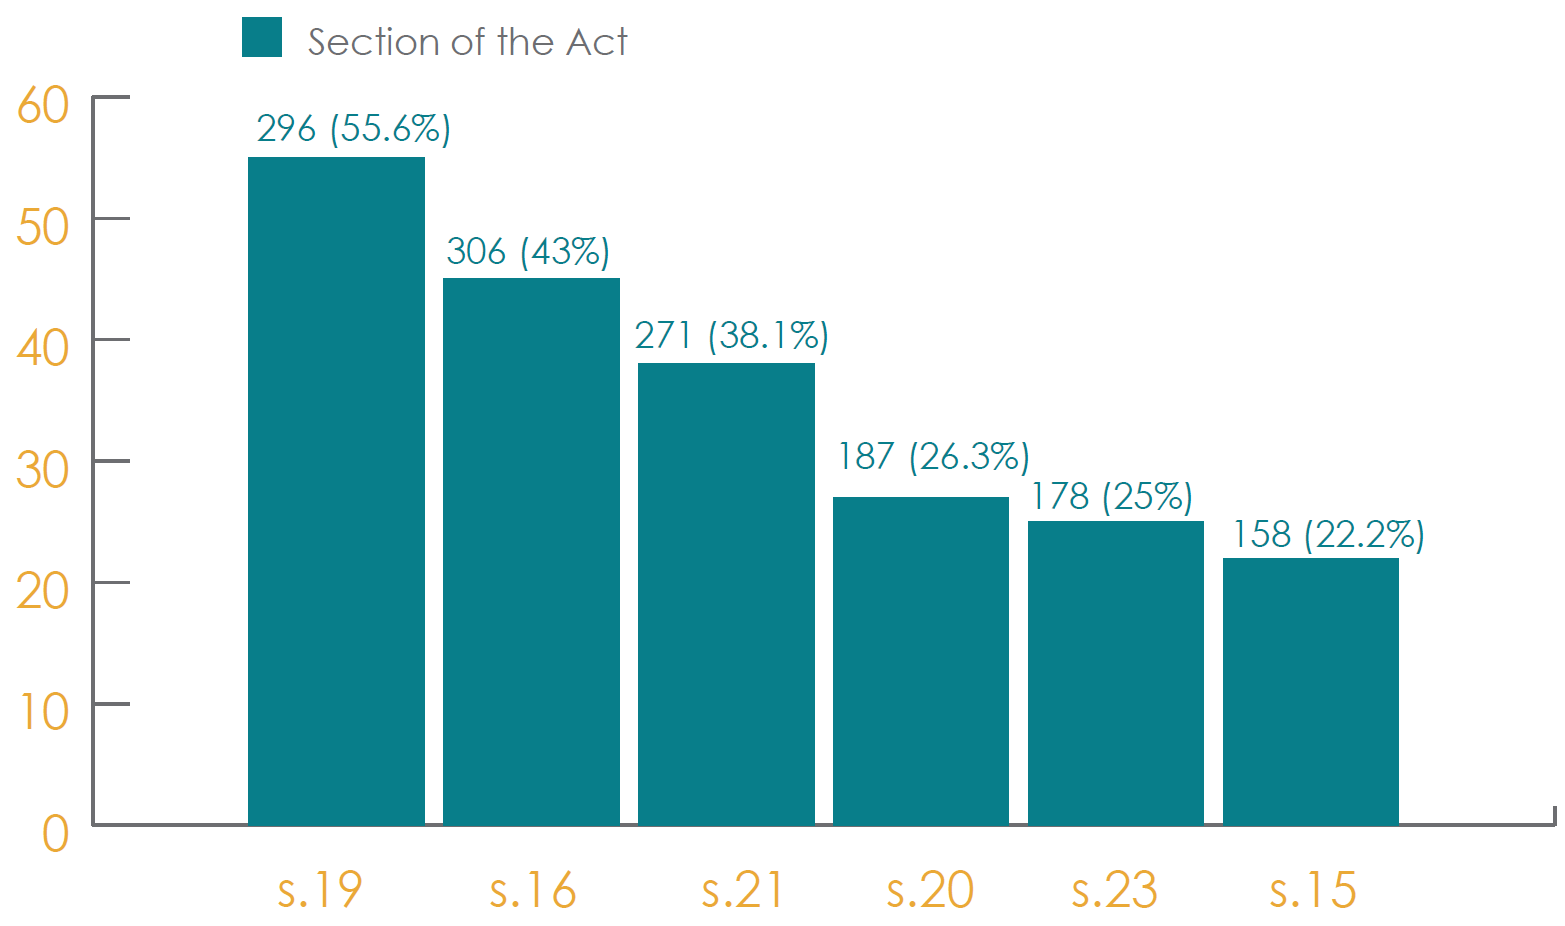
The vertical bar chart shows the exemptions institutions cited the most frequently in the exemption complaints registered in 2015–2016. The X-axis refers to the exemption provision in the Act, while the Y-axis shows the number of complaints in which the exemption was cited, as a proportion of the total number of exemption complaints registered.
The figures are as follows:
- personal information (section 19): 296 complaints (or 55.6% of all exemption complaints registered);
- law enforcement and investigations (section 16): 306 complaints (or 43%);
- advice and recommendations to government (section 21): 271 complaints (or 38.1%);
- third-party information (section 20): 187 complaints (or 26.3%);
- solicitor-client privilege (section 23): 178 complaints (or 25%); and
- international affairs (section 15): 158 complaints (or 22.2%).
The most commonly cited exemption in complaints to the Commissioner in 2015–2016 was section 19 (personal information), followed by sections 16 (law enforcement and investigations), 21 (advice and recommendations to government), 20 (third party information), 23 (solicitor-client privilege), and lastly, 15 (international affairs and defence).
New complaints by institution, 2011–2012 to 2015–2016Footnote 4
| 2011–2012 | 2012–2013 | 2013–2014 | 2014–2015 | 2015–2016 | |
|---|---|---|---|---|---|
| Canada Revenue Agency |
324 |
336 |
283 |
221 |
271 |
| Royal Canadian Mounted Police |
68 |
125 |
185 |
178 |
235 |
| Immigration, Refugees and Citizenship Canada |
66 |
109 |
305 |
246 |
181 |
| Canada Border Services Agency |
36 |
63 |
106 |
78 |
161 |
| Public Service Commission of Canada |
8 |
7 |
3 |
1 |
115 |
| National Defence |
74 |
72 |
119 |
117 |
93 |
| Global Affairs Canada |
56 |
83 |
120 |
83 |
86 |
| Procurement and Government Services Canada |
45 |
35 |
28 |
26 |
78 |
| Correctional Service Canada |
65 |
57 |
56 |
33 |
59 |
| Transport Canada |
30 |
72 |
83 |
87 |
57 |
| Privy Council Office |
36 |
52 |
48 |
54 |
50 |
| Department of Justice Canada |
47 |
24 |
51 |
44 |
44 |
| Natural Resources Canada |
12 |
21 |
38 |
35 |
41 |
| Employment and Social Development Canada |
25 |
20 |
37 |
33 |
38 |
| Sustainable Development Technology Canada |
0 |
0 |
0 |
0 |
38 |
| Environment and Climate Change Canada |
17 |
26 |
29 |
26 |
35 |
| Canadian Security Intelligence Service |
8 |
15 |
20 |
27 |
34 |
| Health Canada |
49 |
37 |
48 |
65 |
32 |
| Canada Post Corporation |
46 |
8 |
10 |
30 |
31 |
| Indigenous Affairs and Northern Affairs Canada |
47 |
45 |
60 |
23 |
31 |
| Others |
406 |
389 |
452 |
342 |
337 |
| Totals |
1,475 |
1,596 |
2,081 |
1,749 |
2,047 |
This chart contains real numbers only and does not reflect the proportion of complaints to the number of requests.
The chart above shows the 20 institutions that received the most complaints in 2015–2016. Many institutions appear on this list from year to year. For example, the top three institutions–Canada Revenue Agency, Royal Canadian Mounted Police and Immigration, Refugees and Citizenship Canada (formerly Citizenship and Immigration Canada) – were in the top three positions in 2014–2015.
Of note are significant increases in complaints against the Public Service Commission of Canada and Sustainable Development Technology Canada. In fact, this is the first year that the Sustainable Development Technology Canada has received complaints since becoming subject to the Act in 2007. In both cases, these increases in complaints can be attributed to a single complainant to each institution.
Health Canada has seen a significant decrease in complaints (less than half as compared to 2014–2015). While no single reason is known for this decrease, there was a spike in complaints in 2014–2015 that was attributed, in part, to one source that made 15 complaints on the same general issue in that year. Further, the OIC has noted an improved level of cooperation and leadership when communicating with Health Canada’s ATIP Directorate in 2015–2016.
Turnaround times for complaint investigations, 2011–2012 to 2015–2016
Complaints closed within nine months from date of assignment
Text Version
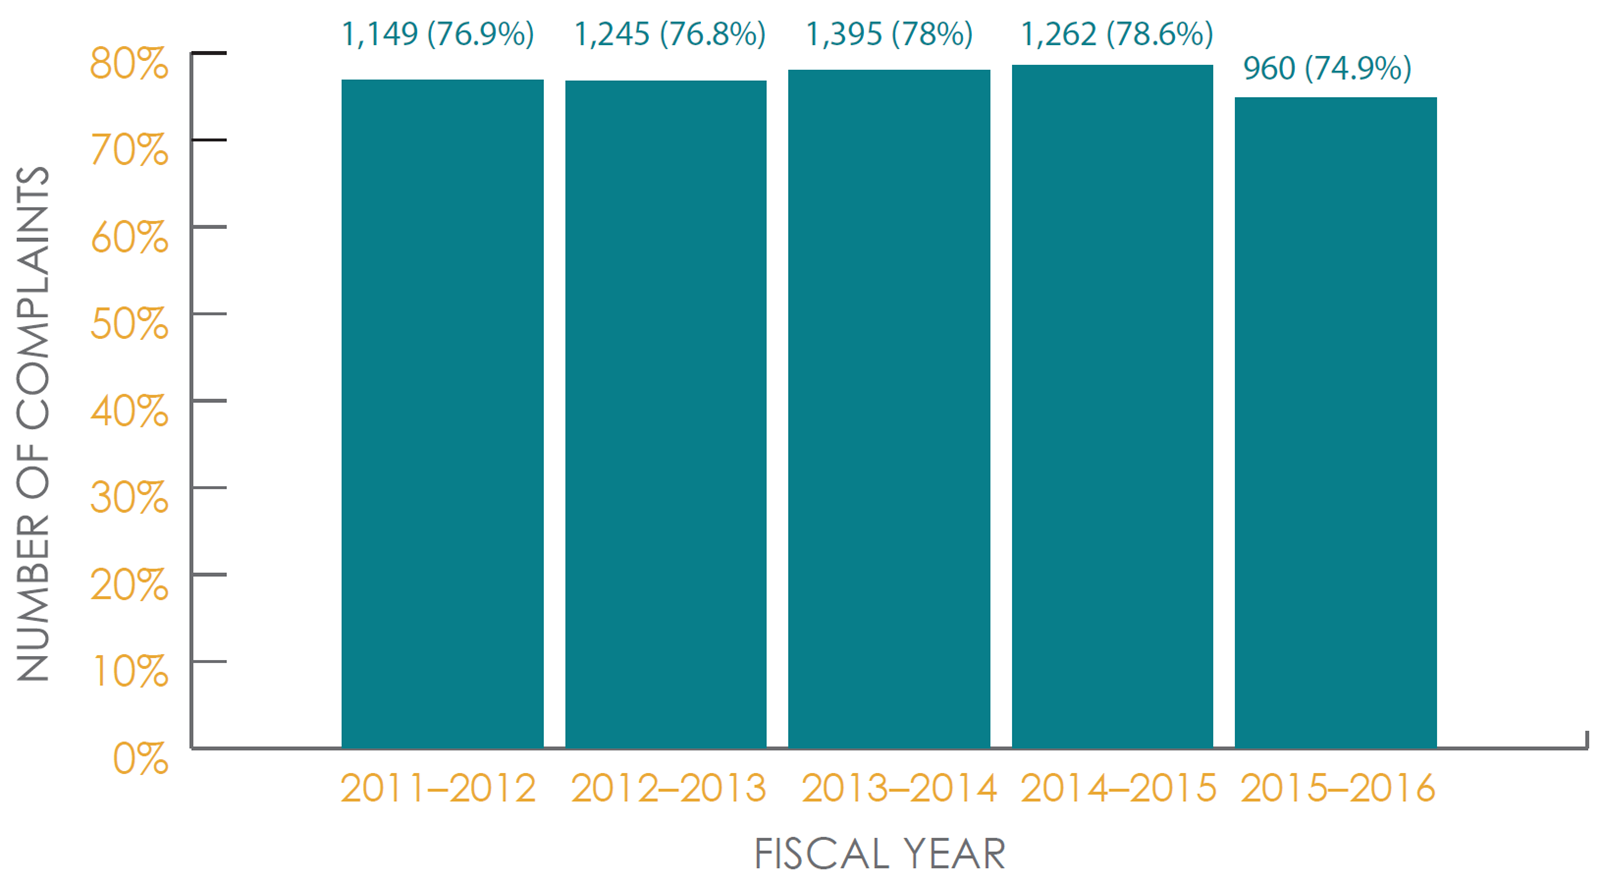
This bar chart shows the proportion of complaints the Commissioner closed within nine months after the date on which they were assigned to an investigator in fiscal years 2011–2012 to 2015–2016.
In 2011–2012, 76.9% of complaints were resolved within nine months (1,149 complaints).
In 2012–2013, 76.8% of complaints were resolved within nine months (1,245 complaints).
In 2013–2014, 78.0% of complaints were resolved within nine months (1,395 complaints).
In 2014–2015, 78.6% of complaints were resolved within nine months (1,262 complaints).
In 2015–2016, 74.9% of complaints were resolved within nine months (960 complaints).
In 2015–2016, the Commissioner closed 74.9 percent of complaints within nine months of their being assigned to an investigator. The overall median turnaround time from the date a file was assigned to an investigator to completion was 84 days. The overall median turnaround time increased by one day from 2014–2015.
However, there is a delay before a file can be assigned to an investigator. The overall median delay was 127 days.
Administrative complaints closed within 90 days from date of assignment
Text Version
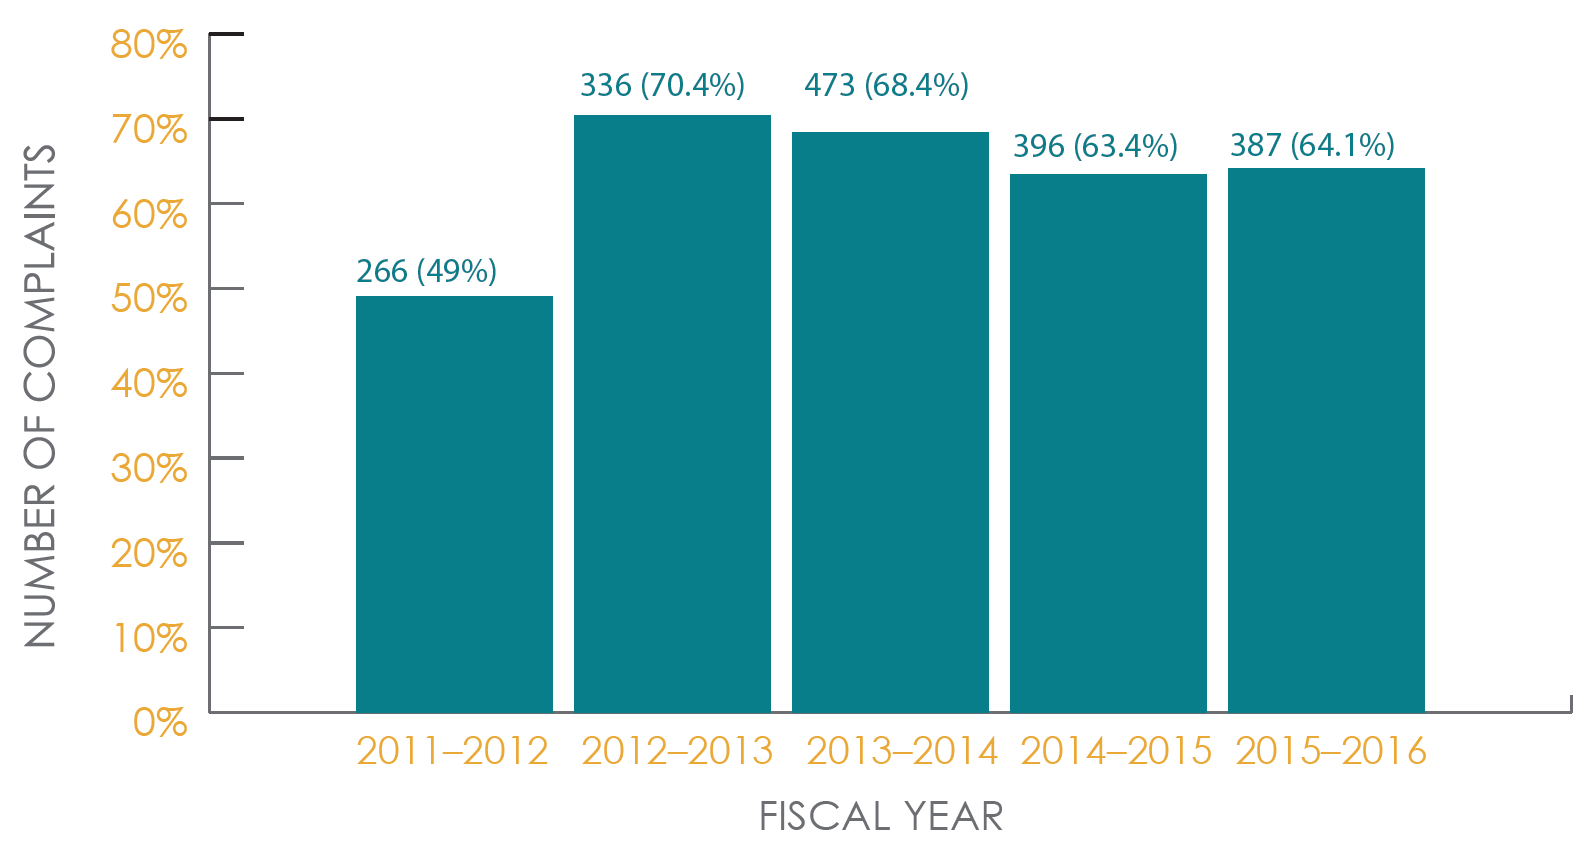
This vertical bar chart shows the proportion of administrative complaints the Commissioner closed within 90 days from date they were assigned to an investigator in fiscal years 2011–2012 to 2015–2016.
In 2011–2012, 49.0% of administrative complaints were resolved within 90 days (266 complaints).
In 2012–2013, 70.4% of administrative complaints were resolved within 90 days (336 complaints).
In 2013–2014, 68.4% of administrative complaints were resolved within 90 days (473 complaints).
In 2014–2015, 63.4% of administrative complaints were resolved within 90 days (396 complaints).
In 2015–2016, 64.1% of administrative complaints were resolved within 90 days (387 complaints).
The Commissioner’s performance objective is to have a median turnaround time of 90 days for administrative complaints. The overall median turnaround time for closing administrative complaints in 2015–2016 from the date files are assigned was 48 days.
The median delay before an administrative complaint could be assigned was 83 days.
Refusal complaints closed within 180 days from date of assignment
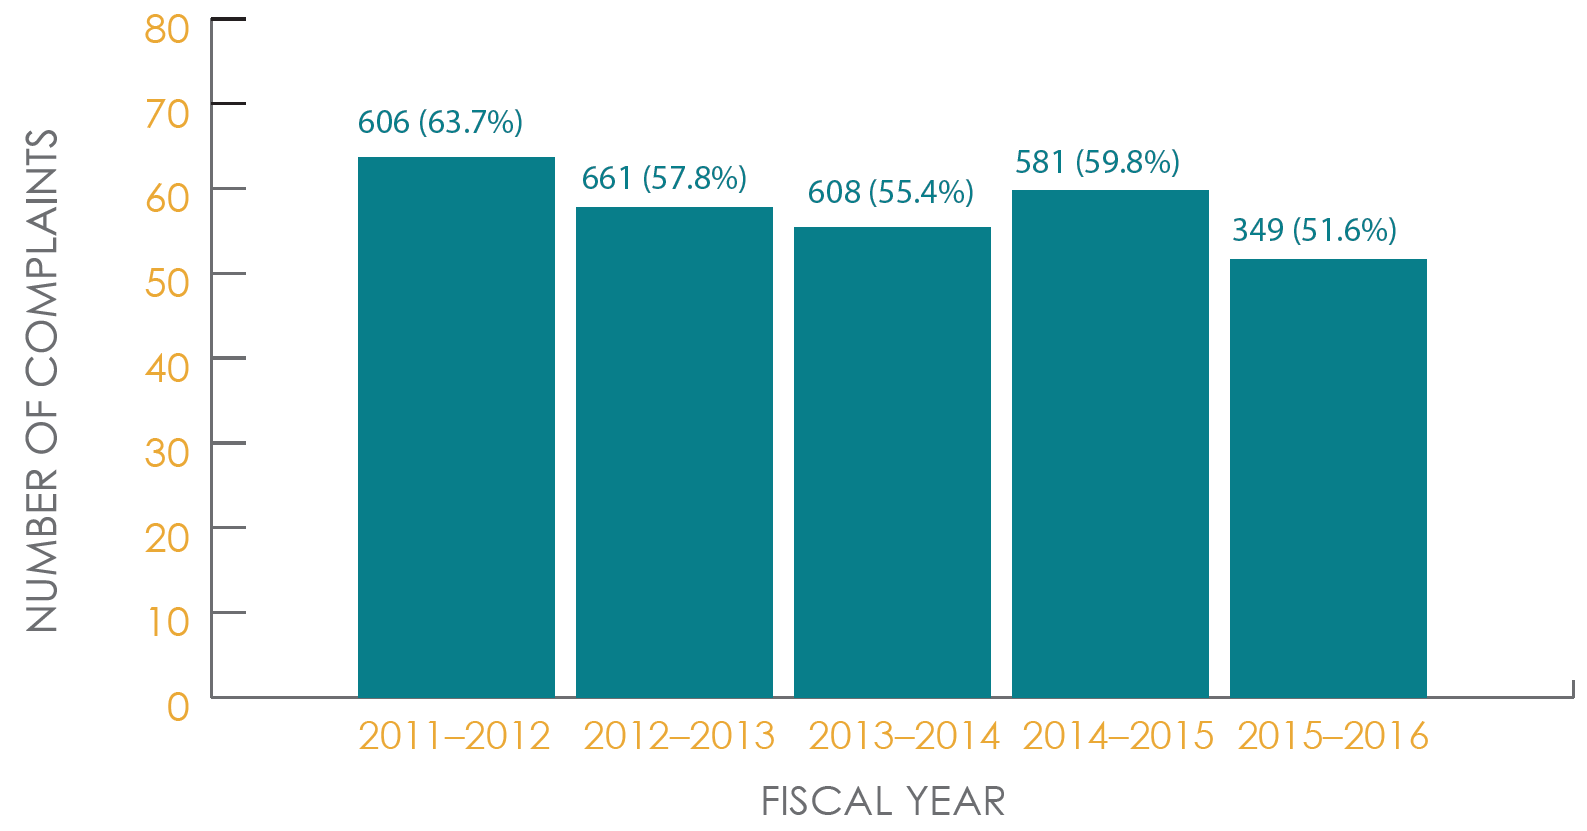
Text Version
This vertical bar chart shows the proportion of refusal complaints the Commissioner closed within six months from the date they were assigned to an investigator during the years 2011–2012 to 2015–2016.
In 2011–2012, 63.7% of refusal complaints were resolved within six months (606 complaints).
In 2012–2013, 57.8% of refusal complaints were resolved within six months (661 complaints).
In 2013–2014, 55.4% of refusal complaints were resolved within six months (608 complaints).
In 2014–2015, 59.8% of refusal complaints were resolved within six months (581 complaints).
In 2015–2016, 51.6% of refusal complaints were resolved within six months (349 complaints).
The Commissioner’s performance objective is to have a median turnaround time of 180 days for refusal complaints. The overall median turnaround time for closing refusal complaints in 2015–2016 from the date files are assigned was 166 days.
The median delay before a refusal complaint could be assigned was 230 days.
| Overall | Well founded | Not well founded | Resolved | Settled | Discon-tinued | |
|---|---|---|---|---|---|---|
| Canada Revenue Agency |
178 |
98 |
38 |
8 |
1 |
33 |
| Royal Canadian Mounted Police |
139 |
62 |
20 |
9 |
14 |
34 |
| Immigration, Refugees Canada |
116 |
58 |
21 |
3 |
4 |
30 |
| National Defence |
83 |
33 |
18 |
2 |
1 |
29 |
| Canada Border Services Agency |
67 |
29 |
12 |
14 |
1 |
11 |
| Canadian Broadcasting Corporation |
58 |
35 |
5 |
0 |
4 |
14 |
| Transport Canada |
48 |
11 |
1 |
2 |
1 |
33 |
| Health Canada |
46 |
23 |
3 |
6 |
0 |
14 |
| Global Affairs Canada |
45 |
23 |
2 |
9 |
1 |
10 |
| Employment and Social Development Canada |
40 |
25 |
2 |
0 |
4 |
9 |
| Privy Council Office |
40 |
17 |
6 |
0 |
1 |
16 |
| Justice Canada |
33 |
20 |
3 |
1 |
1 |
8 |
| Correctional Service Canada |
32 |
14 |
4 |
3 |
3 |
8 |
| Indigenous and Northern Affairs Canada |
28 |
12 |
2 |
4 |
2 |
8 |
| Environment and Climate Change Canada |
26 |
19 |
0 |
0 |
0 |
7 |
| Public Service Commission of Canada |
22 |
14 |
5 |
0 |
0 |
3 |
| Fisheries and Oceans Canada |
21 |
13 |
1 |
0 |
1 |
6 |
| Innovation, Science and Economic Development Canada |
19 |
3 |
2 |
0 |
1 |
13 |
| Public Safety Canada |
18 |
6 |
7 |
0 |
0 |
5 |
| Procurement and Government Services Canada |
16 |
5 |
2 |
2 |
0 |
7 |
| Via Rail Canada Inc. |
16 |
0 |
0 |
0 |
16 |
0 |
| Others (66 institutions) |
190 |
75 |
41 |
4 |
15 |
55 |
| Total:Footnote 5 |
1,281 |
595 |
195 |
67 |
71 |
353 |
This chart lists the 20 institutions about which the Commissioner completed the most complaints in 2015–2016.
Footnotes
- Footnote 1
-
The Commissioner may launch a complaint under subsection 30(3) of the Access to Information Act.
- Footnote 2
-
A new resolved finding was introduced in March 2016. Resolved findings are for cases of deemed refusal (delay) and extension complaints where the final response to the requester has been sent during the initial stages of the investigation.
- Footnote 3
-
Written inquiries are correspondence received by the Office of the Information Commissioner (OIC) that may be a new complaint under the Access to Information Act, but require further scrutiny by the OIC’s registrars to determine if they are so. For example, sometimes it must be determined if the complaint falls within the Commissioner’s jurisdiction to investigate. Even when a written inquiry would not eventually become a complaint, a response must still be sent.
- Footnote 4
-
Institutions are listed by the number of complaints the Commissioner received about them in 2015–2016. The figures for each year include any complaints initiated by the Commissioner under subsection 30(3) of the Access to Information Act (18 in 2015–2016).
- Footnote 5
-
The total number of complaints closed includes any that had been initiated by the Commissioner under subsection 30(3) of the Access to Information Act (11 in 2015–2016).