2008-2009 Facts and figures
| Previous | Table of contents | Next |
Table 1 summarizes our caseload for 2008–2009 and compares it to the two previous years. It shows the extent of the challenge we were facing at the beginning of the year with a total of 2,293 cases carried over from the previous year. This carry over partially resulted from the surge in the number of new complaints we experienced in 2007–2008—an increase of more than 80 percent over the previous year—which has since remained roughly at the same level.
We also registered 2,018 new cases in 2008–2009. Despite this substantial workload and limited investigative resources, we were able to close 1,770 complaints in 2008–2009, compared to 1,381 complaints in 2007–2008.
More importantly, as suggested by Table 1, there are promising signs that, starting in August 2008, the implementation of our new investigative process has contributed to halting the growth of our inventory of ongoing cases.
Table 1. Summary of caseload, 2006–2007 to 2008–2009
| 2006–2007 | 2007–2008 | 2008–2009 | |
| Complaints received | |||
| Complaints carried over from the previous year | 1,453 | 1,420 | 2,293 * |
| New complaints | 1,317 | 2,387 | 2,018 |
| Complaints cancelled during the year | 82 | 108 | 28 ** |
| Complaints pending at year-end | 1,420 | 2,318 * | 2,513 |
| Outcome of complaints | |||
| Complaints discontinued during the year | 449 | 108 | 652 |
| Complaints completed during the year with findings | 819 | 1,273 | 1,118 |
| Total of complaints closed during the year | 1, 268 | 1,381 | 1,770 |
| Commissioner-initiated complaints | |||
| Complaints carried over from the previous year | 423 | 237 | 0 |
| New complaints | 393 | 0 | 1 |
| Complaints closed during the year | 579 | 237 | 0 |
| Complaints pending at year-end | 237 | 0 | 1 |
| Report cards initiated during the year | 17 | 10 | *** |
* Figure adjusted after year-end to avoid duplication – 25 complaints received at the end of March 2008 were registered at the beginning of April 2008.
** We stopped using the “cancelled” category in June 2008 when we set up our new intake process. These 28 complaints were cancelled before this change was made. In the past, a complaint was registered upon receipt and then cancelled after we determined that it was not valid under the Act (for example, it was made beyond the time allowed or the complainant withdrew or abandoned it before the investigation began). As of June 2008, we register a complaint once we review it and obtain, where necessary, sufficient information to determine that it is a valid complaint. A complaint that is found not to be valid is now treated as a general enquiry.
*** The 2007 -2008 report cards were completed during the following fiscal year and published in February 2009.
Figure 1. Trends in the status at month end of the inventory of all active complaints, 2008–2009*
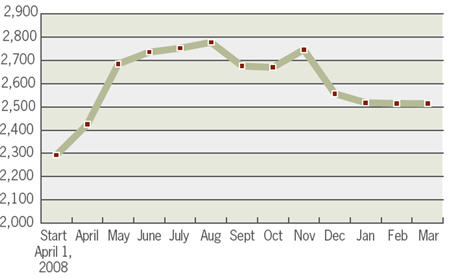
* The inventory includes one Commissioner-initiated complaint

New complaints in 2008–2009
As in previous years, the complaints we received in 2008–2009 fell into three broad categories: administrative complaints, refusal complaints and complaints related to exclusions for Cabinet confidences.
- Administrative complaints generally pertain to time extensions or delays from institutions in responding to access requests, or to the fees they propose to charge.
- Refusal complaints include cases of exemptions — where an institution withheld information under specific provisions of the Act —, incomplete responses or requests for which no relevant documentation was found.
- Cabinet confidence exclusion complaints relate to situations where access to records was refused because they contain Cabinet confidences, which are excluded from the Act and which, consequently, institutions may not release.
Figure 2 sets out the complaints we registered in 2008–2009 according to these three categories. Of the 2,019 new complaints (2,018 complaints registered and one Commissioner-initiated complaint), 52 percent were administrative complaints—a relatively high percentage which demonstrates the persistence of system-wide or recurrent issues.
Figure 2. Types of complaints registered, 2008–2009
![[image]](/sites/default/files/userfiles/images/oic-eng/reports_and_publications/annual_reports/2008-2009/types_of_complaints_registered_2008_2009_450-eng.jpg)
Table 2. New complaints in 2008–2009, by institution*
| Institution | Complaints |
| Canada Revenue Agency | 302 |
| National Defence | 226 |
| Canadian Broadcasting Corporation | 221 |
| Privy Council Office | 198 |
| Royal Canadian Mounted Police | 106 |
| Department of Foreign Affairs and International Trade | 94 |
| Industry Canada | 79 |
| Correctional Service Canada | 60 |
| Environment Canada | 54 |
| Transport Canada | 52 |
| Public Works and Government Services Canada | 52 |
| Citizenship and Immigration Canada | 51 |
| Canada Post Corporation | 51 |
| Health Canada | 44 |
| Telefilm Canada | 39 |
| Others (66 institutions) | 390 |
| Total | 2,019 |
* Includes one Commissioner-initiated complaint
Processing and disposition of complaints
Figure 3 shows the turnaround times for the 1,770 complaints we closed in 2008–2009. The average for the year was 13 months. This is mainly due to the fact that the huge inventory contained a high number of files that were already several years old, which skewed the calculation of the turnaround times.
As we work to eradicate the old inventory and the new investigative process in place allows us to gain in efficiency, we expect to substantially shorten our average turnaround times next year. To this end, the upcoming results of an internal audit which the Information Commissioner has requested on our new intake and early resolution methods, will guide us in making further adjustments. Moreover, as pre-April 1, 2008 files are now dealt separately from the new caseload, our statistics next year will shed more light on the effectiveness of the investigative process on improving timeliness.
Figure 3. Turnaround times for complaints closed, 2008–2009
![[image]](/sites/default/files/userfiles/images/oic-eng/reports_and_publications/annual_reports/2008-2009/turnaround_times_for_complaints_closed_450-eng.jpg)
Figure 4 breaks down the outcomes of complaints closed in 2008–2009 by type of complaint. As in previous years, we found refusal complaints and Cabinet confidence exclusion complaints to be not substantiated more often than we did administrative complaints.
We also note a much higher proportion of discontinued complaints than in previous years. This can be explained largely by the fact that our inventory reduction strategy focused on quickly following up on the high number of time-related complaints (delays and time extensions) that had piled up in the inventory. In many instances, we received confirmation that the institutions had responded to the requesters some time after the complaints were filed, and the complaints therefore were discontinued. In another case, we were able to successfully mediate an issue which resulted in the withdrawal of 290 administrative complaints at once.
Figure 4. Outcome by type of complaint, 2008–2009
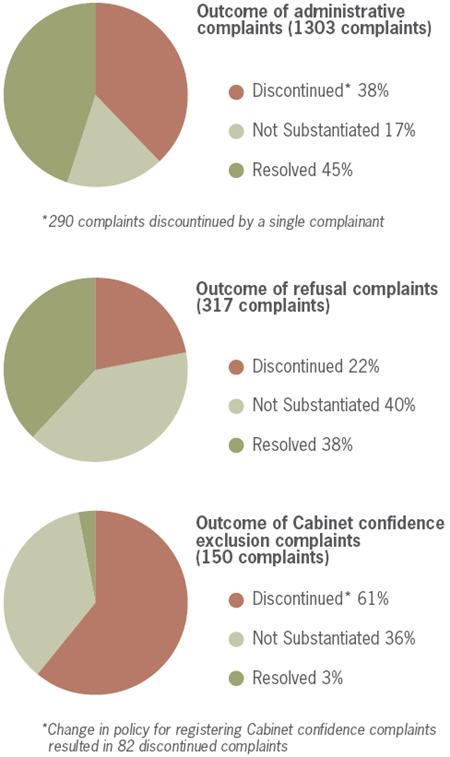
Table 3. Complaints completed with findings in 2008–2009, by institution
| Institution | Complaints Overall | With Merit |
| National Defence | 218 | 150 |
| Canada Revenue Agency | 149 | 125 |
| Privy Council Office | 75 | 28 |
| Royal Canadian Mounted Police | 62 | 24 |
| Environment Canada | 44 | 24 |
| Department of Foreign Affairs and International Trade | 41 | 34 |
| Canada Post Corporation | 32 | 28 |
| Health Canada | 30 | 27 |
| Public Safety Canada | 29 | 18 |
| Public Works and Government Services Canada | 27 | 19 |
| Department of Justice Canada | 27 | 7 |
| Industry Canada | 26 | 4 |
| Atomic Energy of Canada Limited | 26 | 24 |
| Canada Border Services Agency | 24 | 15 |
| Correctional Service Canada | 22 | 15 |
| Transport Canada | 22 | 20 |
| Canadian Heritage | 22 | 13 |
| Others (46 institutions) | 242 | 150 |
| Total | 1,118 | 725 |
Pre-April 1, 2008 inventory
As previously mentioned, we have committed to eliminating our pre-April 1, 2008 inventory of complaints by March 31, 2010. To this end, we were able to close half of it this year - 1,167 complaints. We started the year with 2,293 complaints that predated April 1, 2008, cancelled 21 of them and closed 678 cases between April and mid-November 2008. In mid-November, the remaining 1,594 cases from this inventory were moved to a dedicated team, which was successful in closing 489 more cases (or 31 percent) in about four months. Figure 5 illustrates the steady decrease of the pre-April 1, 2008 inventory, starting in December 2008.
Figure 5. Status at month end of the pre-April 1, 2008 inventory, November 2008-March 2009
![[image]](/sites/default/files/userfiles/images/oic-eng/reports_and_publications/annual_reports/2008-2009/status_at_month_end_of_the_pre-april_1_2008_450-eng.jpg)
| Previous | Table of contents | Next |