2014-2015 Transport Canada
Overall performanceFootnote 1
Transport Canada (TC) improved its performance by 16.7% with respect to the percent of requests completed within 30 days. There was also a decrease of 14.1% in the number of requests received. This report provides comparative statistics for the last three periods (2012-2015).
Workload
TC received 937 requests under the Access to Information Act (the Act) representing a 14.1% decrease from the previous period. The majority of requests received were from the media (39.2%), followed by the business sector (30.6%) and the public (23.6%). Requests from the public increased by 11% this reporting period compared to 2013-2014. In contrast to the previous period, requests from the media and the business sector decreased by 22.2% and 6.8% respectively.
TC completed 1,167 requests this reporting period compared to 1,794 in 2013-2014. The completion rateFootnote 2 was 90.2%, which is higher than the government-wide rate of 85.1%. In 2013-2014, TC’s completion rate was 82.6%. TC also received 245 informal requests, of which 85.7% were completed within 30 days. The number of consultations received by TC from other federal government institutions decreased from 265 to 218, representing a decrease of 17.7% compared to 2013-2014.
The total number of pages processed by TC was 306,012 pages, in contrast to 202,969 the year before. There was also an increase in the average number of pages processed per completed request, which increased from 159 in 2013-2014 to 308 in 2014-2015 (see Table 1).
The information released by TC was mostly in paper format: 583 in paper format compared to 199 in electronic format. This is considerably different compared to the previous year (901 in paper format compared to 57 in electronic).
Table 1. Workload
| Measures | 2012-2013 | 2013-2014 | 2014-2015 |
|---|---|---|---|
| Number of requests received | 2,197 | 1,091 | 937 |
| Annual change (%) | - | -50.3% | -14.1% |
| Completed requests | 1,419 | 1,794 | 1,167 |
| Annual change | - | 26.4% | -34.9% |
| Number of consultations received (from other government institutions) | 265 | 265 | 218 |
| Annual change (%) | - | 0.0% | -17.7% |
| Average number of pages processed per request completed | 104 | 159 | 308 |
| % of requests for which more than 1,000 pages were processed | 2.2% | 2.8% | 7.9% |
Request completion time
Timeliness
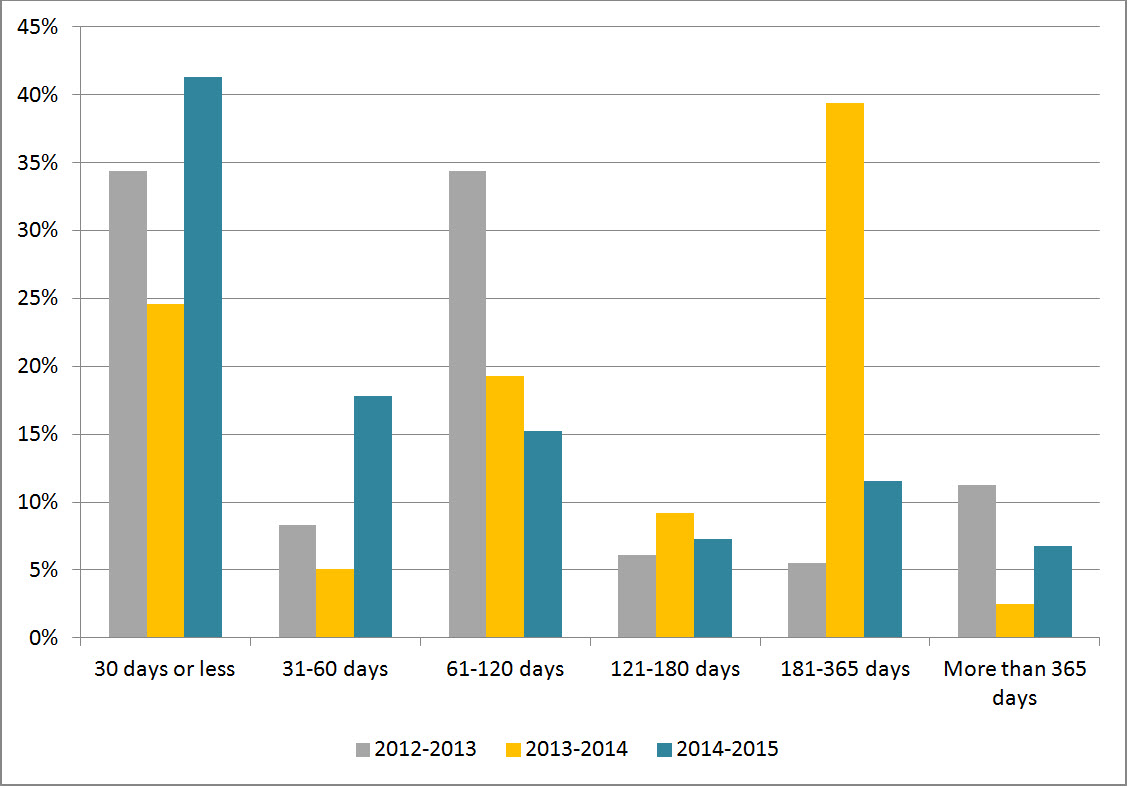
Figure 1 shows that 41.3% of requests were completed within 30 days or less, which is almost double the results observed in 2013-2014 (24.6%).
Figure 1: Request Completion Time
Text version
Figure 1 is a bar chart with vertical bars, representing the completion time by TC during each reporting period between 2012-2013 and 2014-2015. The results are as follows:
| Completion time | 2012-2013 | 2013-2014 | 2014-2015 |
|---|---|---|---|
| 30 days or less | 34.39% | 24.58% | 41.30% |
| 31-60 days | 8.32% | 5.07% | 17.82% |
| 61-120 days | 34.39% | 19.29% | 15.25% |
| 121-180 days | 6.13% | 9.20% | 7.28% |
| 181-365 days | 5.50% | 39.35% | 11.57% |
| More than 365 days | 11.28% | 2.51% | 6.77% |
Extensions
TC took a total of 855 extensions in 2014-2015 compared to 2,322 the year before. The most common reason for taking an extension was interference with operations (53.3%), followed by third-party notice (27.7%). Interference with operations was also the institution’s most common reason for extensions in 2013-2014.
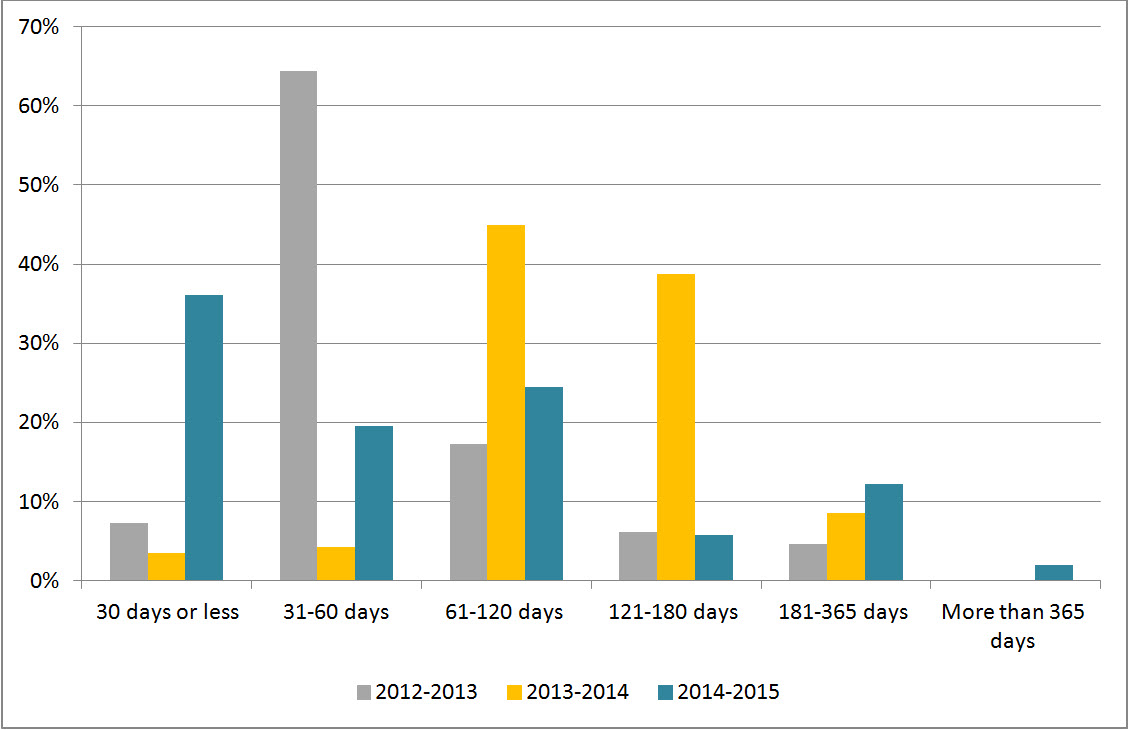
Figure 2 shows that 36.1% of extensions were taken for less than 30 days. This measure is significantly higher than the previous period’s results, where 3.4% of extensions were processed within 30 days or less. Figure 2 also shows that the number of requests extended between 31 and 60 days increased from 4.3% in 2013-2014 to 19.5% in 2014-2015.
Figure 2: Length of Extensions
Text version
Figure 2 is a bar chart with vertical bars, representing the length of extensions taken by TC during each reporting period between 2012-2013 and 2014-2015. The results are as follows:
| Length of extensions | 2012-2013 | 2013-2014 | 2014-2015 |
|---|---|---|---|
| 30 days or less | 7.32% | 3.45% | 36.14% |
| 31-60 days | 64.46% | 4.26% | 19.53% |
| 61-120 days | 17.31% | 44.96% | 24.44% |
| 121-180 days | 6.16% | 38.76% | 5.73% |
| 181-365 days | 4.65% | 8.57% | 12.16% |
| More than 365 days | 0.12% | 0.0% | 1.99% |
Deemed refusals
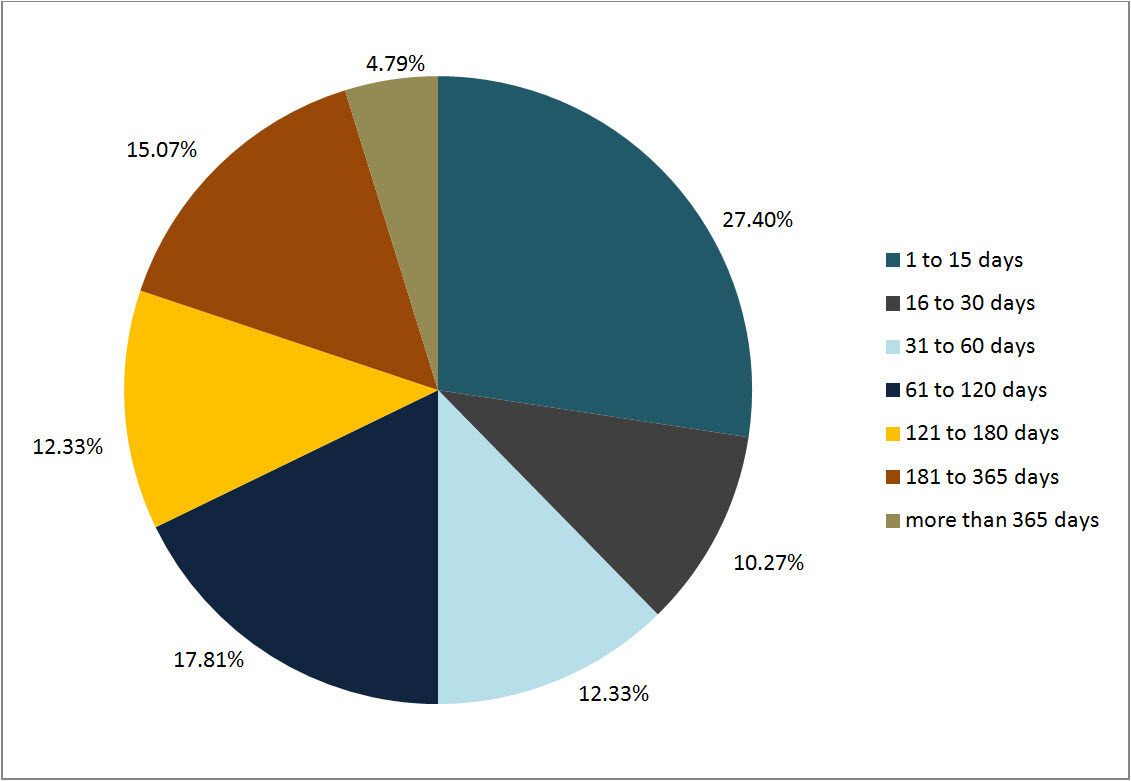
In 2014-2015, the number of requests closed past the statutory deadline was 146, which accounts for 12.5% of completed requests. This rate represents a “C” grade and a drop from an “A” (4.6%) in the previous period.Footnote 3 The main reason for overdue requests this reporting period was workload (67.8%). Figure 3 shows that 37.7% of overdue requests were late by 30 days or less.
Figure 3: Lateness of Overdue Requests
Text version
Figure 3 is a pie chart, representing the delayed days for overdue requests taken by TC in 2014-2015. The results are as follows:
| Number of days | 2014-2015 |
|---|---|
| 1 to 15 days | 27.40% |
| 16 to 30 days | 10.27% |
| 31 to 60 days | 12.33% |
| 61 to 120 days | 17.81% |
| 121 to 180 days | 12.33% |
| 181 to 365 days | 15.07% |
| More than 365 days | 4.79% |
| Total | 100.0% |
Disclosure
Percentage of requests for which information was disclosed
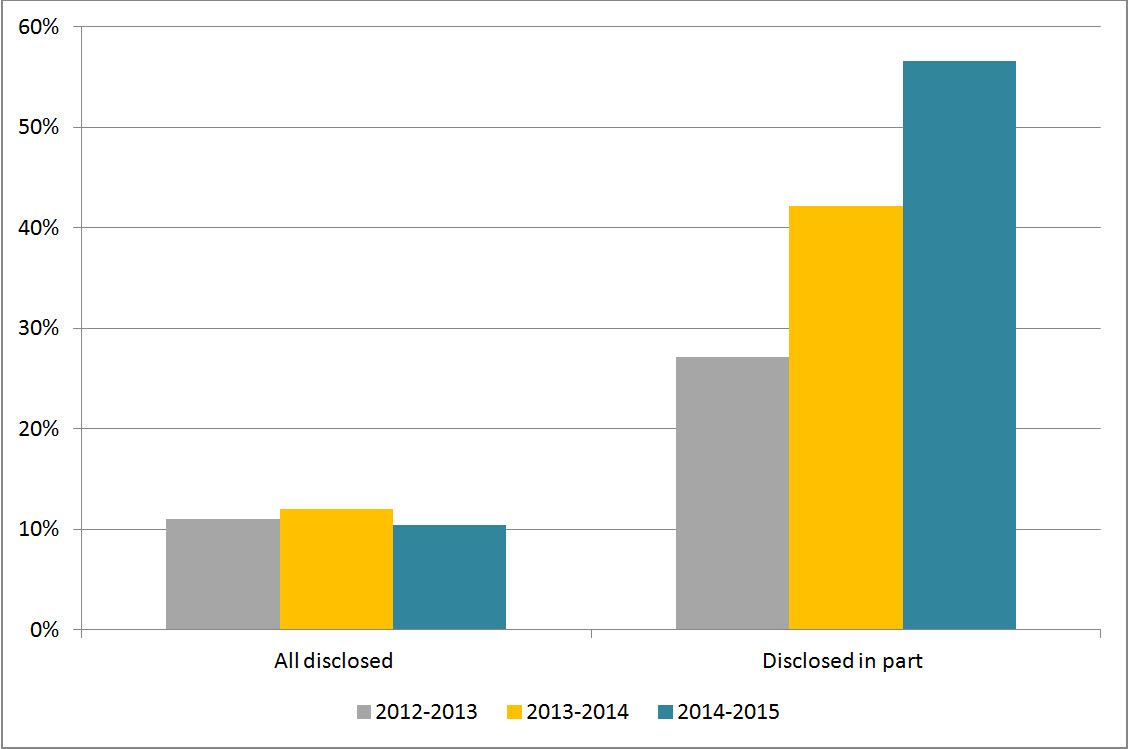
In 2014-2015, 10.5% of completed requests were entirely disclosed. This is only marginally lower than previous years (see Figure 4). Figure 4 also shows that the rate for partially disclosed requests was 56.6% in 2014-2015, which is an increase of 14.4% from the previous period.
Figure 4: Level of Disclosure
Text version
Figure 4 is a bar-chart with vertical bars, representing the entirely disclosed and disclosed in part requests as proportion of total requests completed by TC during each reporting period between 2012-2013 and 2014-2015. The results are as follows:
| Disclosure | 2012-2013 | 2013-2014 | 2014-2015 |
|---|---|---|---|
| All disclosed | 10.99% | 11.98 % | 10.45% |
| Disclosed in part | 27.13% | 42.14% | 56.56% |
Exemptions
The average number of exemptions used per completed request increased from 1.61 in 2013-2014 to 2.11 in 2013-2014 (see Table 2). The most frequent exemptions applied in 2014-2015 were section 21 (Operations of Government) (26.8%), section 20 (Third-Party Information) (24.2%) and section 19 (Personal Information) (20.4%). The application of all three provisions nearly doubled in comparison to the previous period.
Table 2: Exemptions
| Exemptions | 2012-2013 | 2013-2014 | 2014-2015 |
|---|---|---|---|
| Total number of exemptions | 1,384 | 2,895 | 2,464 |
| Total number of completed requests | 1,419 | 1,794 | 1,167 |
| Average number of exemptions per completed request | 0.98 | 1.61 | 2.11 |
Complaints at the OIC
In 2014-2015, the OIC received 87 complaintsFootnote 4 against TC, which is a slight increase from the 83 complaints received the previous period. The majority of complaints were refusals. Compared to the previous year, the difference between administrative and refusal complaints marks a substantial increase (38 administrative and 45 refusal complaints in 2013-2014 compared to 16 administrative and 71 refusals in 2014-2015).
In this reporting period, 3 complaints were not well-founded, 16 were well-founded and resolved, 38 were discontinued and 29 were pending resolution.
Footnotes
- Footnote 1
-
Overall performance is based on two primary indicators: % of requests completed within 30 days, % of requests that were fully disclosed.
- Footnote 2
-
The completion rate was calculated using the number of received requests during the reporting period as well as outstanding requests from the previous period.
- Footnote 3
-
The 2007-2008 OIC report card grading system was used to estimate the grade A= 0 to 5%; B= 5 to 10%; C=10 to 15%, D= 15 to 20%, F=20% and more.
- Footnote 4
-
The numbers reported in this section are based on the OIC’s statistics. The information may not reflect the statistics reported by institutions due to the discrepancies in the methodology used.