2014-2015 Public Safety Canada
Overall performanceFootnote 1
Public Safety Canada (PS) completed 85.1% of their requests in inventory in 2014-2015. While the overall performance of PS appears to have decreased significantly, it can be explained in part by the statistical changes made by TBS in how they require institutions to capture the data.Footnote 2
Workload
In 2014-2015, PS received 310 formal requests under the Access to Information Act (the Act), representing 0.5% of requests received across government. They also received 118 informal requests, for a combined total of 428. In comparison, PS received a total of 465 requests in 2013-2014.
The majority of formal requests received in 2014-2015 were from the media (66.1%), followed by the public (22.3%).
PS completed 292 formal requests this reporting period. The overall completion rateFootnote 3 was 85.1%, which is the same as the government-wide rate. In 2013-2014, the completion rate for PS was 94.1%. The number of consultations received by PS from other federal government institutions decreased from 255 to 238, representing a decrease of 6.7% compared to 2013-2014.
The total number of pages processed for formal requests by PS this reporting period was 80,193 pages, representing a decrease compared to the 110,041 pages processed in the previous period. The average number of pages processed per completed requests also a decreased from 348 pages in 2013-2014 to 341 pages in 2014-2015.
In 2014-2015, the information released within a formal request by PS was mostly in electronic format: 148 requests in electronic format compared to 47 in paper format.
Table 1: Workload
| Measures | 2012-2013 | 2013-2014 | 2014-2015 |
|---|---|---|---|
| Number of requests received | 494 | 465 | 310 |
| Annual change (%) | - | -5.9% | -33.3% |
| Completed requests | 478 | 527 | 292 |
| Annual change | - | 10.3% | -44.6% |
| Number of consultations received (from other government institutions) | 244 | 255 | 238 |
| Annual change (%) | - | 4.5% | -6.7% |
| Average number of pages processed per request completed | 329 | 348 | 341 |
| % of requests for which more than 1,000 pages were processed | 9.9% | 10.8% | 6.8% |
Requests completion time
Timeliness
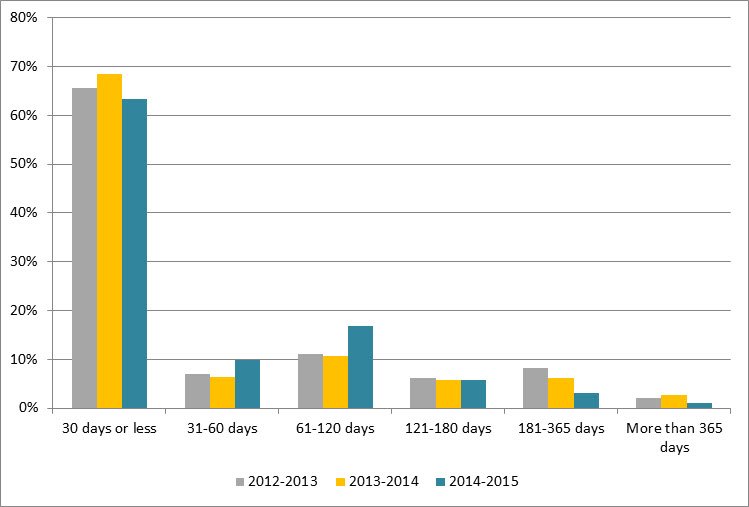
Figure 1 shows that 63.4% of requests were completed within 30 days or less, which is 5.1% lower than the results observed in 2013-2014 (68.5%).Footnote 4 We observe an increase in the proportion of requests completed between 31 and 120 days.
Figure 1: Request Completion Time
Text version
Figure 1 is a bar chart with vertical bars, representing the completion time by PS during each reporting period from 2012-2013 to 2014-2015. The results are as follows:
| Completion time | 2012-2013 | 2013-2014 | 2014-2015 |
|---|---|---|---|
| 30 days or less | 65.69% | 68.50% | 63.4% |
| 31-60 days | 6.90% | 6.45% | 9.9% |
| 61-120 days | 11.09% | 10.63% | 16.8% |
| 121-180 days | 6.07% | 5.69% | 5.8% |
| 181-365 days | 8.16% | 6.07% | 3.1% |
| More than 365 days | 2.09% | 2.66% | 1.0% |
Extensions
PS took a total of 143 extensions in 2014-2015 compared to 224 in 2013-2014. The most common reason for taking an extension was consultations (67.8%), followed by interference with operations (28.0%). 6 extensions were taken for third-party notice.
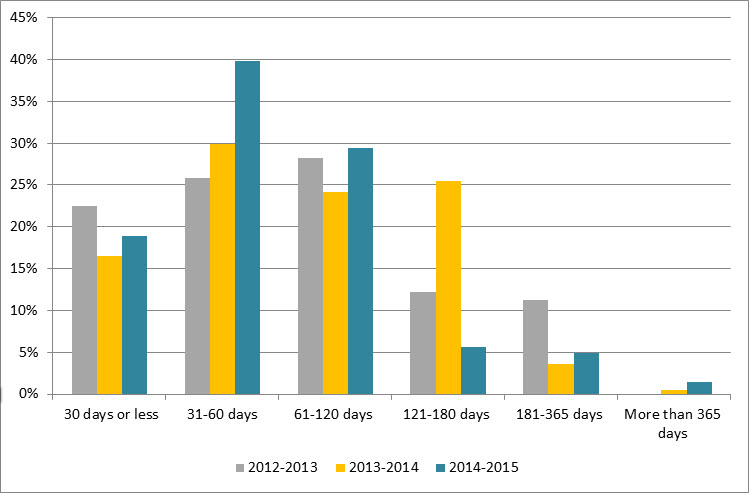
Figure 2 shows that 18.9% of extensions were taken for 30 days of less, which represents a 2.4% increase from 2013-2014. Figure 2 shows that the proportion of extensions taken between 31 and 60 days in 2014-2015 increased by 10%, from 29.9% in 2013-2014 to 39.9% in 2014-2015.
Figure 2: Length of Extensions
Text version
Figure 2 is a bar chart with vertical bars, representing the length of extensions taken by PS during each reporting period from 2012-2013 to 2014-2015. The results are as follows:
| Length of extensions in % | 2012-2013 | 2013-2014 | 2014-2015 |
|---|---|---|---|
| 30 days or less | 22.54% | 16.52% | 18.88% |
| 31-60 days | 25.82% | 29.91% | 39.86% |
| 61-120 days | 28.17% | 24.11% | 29.37% |
| 121-180 days | 12.21% | 25.45% | 5.59% |
| 181-365 days | 11.27% | 3.57% | 4.90% |
| More than 365 days | 0.00% | 0.45% | 1.40% |
Deemed refusals
In 2014-2015, the number of requests closed past the statutory deadlineFootnote 5 was 4, which accounts for 1.3% of completed requests. This rate represents an “A” grade.Footnote 6 Compared to the last period, the number of requests in deemed refusal decreased (from 22 to 4).
Disclosure
Percentage of requests for which information was disclosed
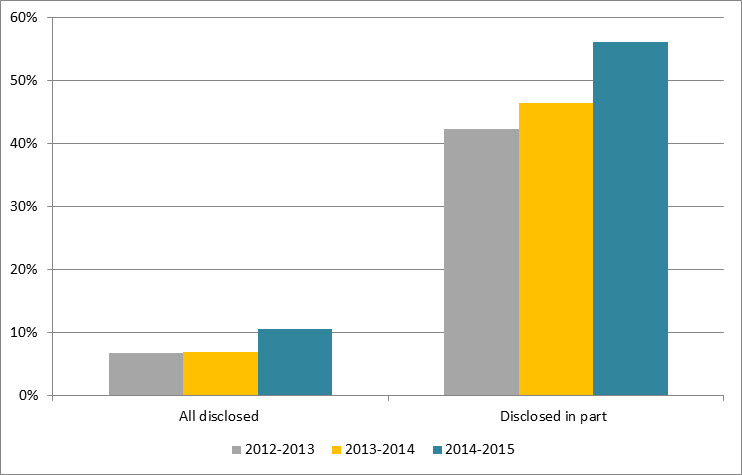
In 2014-2015, 10.6% of completed requests were entirely disclosed, which is PS’s highest disclosure rate since 2012 (see Figure 3). Figure 3 also shows that the rate for partially disclosed requests was 56.2% in 2014-2015, which is an increase of 9.7% compared to 2013-2014.
Figure 3: Level of Disclosure
Text version
Figure 3 is a bar-chart with vertical bars, representing the entirely disclosed and disclosed in part requests as proportion of total requests received by PS during each reporting period between 2012-2013 and 2014-2015. The results are as follows:
| Disclosure | 2012-2013 | 2013-2014 | 2014-2015 |
|---|---|---|---|
| All disclosed | 6.69% | 6.83% | 10.62% |
| Disclosed in part | 42.26% | 46.49% | 56.16% |
Exemptions
In 2014-2015, PS’s use of exemptions decreased from 1,295 in 2013-2014 to 810. Still, the average number of exemptions used per completed requests increased slightly from 2.46 in 2013-2014 to 2.77 in 2014-2015 (see Table 2).
The most frequent used exemptions were section 16 (Law Enforcement and Investigations) (19.5%), section 21 (Operations of Government) (19.4%) and section 19 (Personal Information) (15.9%).
Table 2: Exemptions
| Exemptions | 2012-2013 | 2013-2014 | 2014-2015 |
|---|---|---|---|
| Total number of exemptions | 1,009 | 1,295 | 810 |
| Total number of completed requests | 478 | 527 | 292 |
| Average number of exemptions per request | 2.11 | 2.46 | 2.77 |
Complaints at the OIC
Since 2012, the OIC received a gradual increase in the number of complaints, increasing (5 in 2012-2013 to 14 in 2013-2014, and then to 25 in 2014-2015).
In 2014-2015, all 25 complaints were refusals, with 7 well-founded and resolved, 7 not well founded, 2 discontinued, and 9 pending resolution.
Footnotes
- Footnote 1
-
Overall performance is based on two primary indicators: % of requests completed within 30 days, % of requests that were fully disclosed.
- Footnote 2
-
In 2014-2015, the TBS introduced “informal requests” as a separate category for reporting. Before 2014-2015, informal requests received and completed by PS were included in the statistical reporting. With the new changes, the informal requests are now separated from the formal request, which makes the comparison with previous years difficult. Therefore, the following analysis should be used with precaution.
- Footnote 3
-
The overall completion rate was calculated using the number of received requests during the reporting period as well as outstanding requests from the previous period. This number does not include informal requests.
- Footnote 4
-
When including the informal requests, the proportion of requests completed within 30 days in 2014-2015 is 73.9%, which represents an increase of 5.4% compared to the proportion in 2013-2014.
- Footnote 5
-
The indicator “Lateness of Overdue Requests” is not being measured for institutions with less than 15 late requests.
- Footnote 6
-
The 2007-2008 OIC report card grading system was used to estimate the grade A= 0 to 5%; B= 5 to 10%; C=10 to 15%, D= 15 to 20%, F=20% and more.