2014-2015 Employment and Social Development Canada
Overall performanceFootnote 1
Employment and Social Development Canada’s (ESDC) percentage of requests completed within 30 days or less decreased by 5.6%. However, the institution saw a significant increase of 34.7% in the number of requests received. This report provides comparative statistics for the last three periods (2012-2015).
Workload
ESDC received 1,160 requests under the Access to Information Act (the Act), which is a 34.7% increase compared to the previous period. The majority of requests received by ESDC were from the business sector (37.6%), followed by the public (24.7%). While the number of requests from the business sector doubled during this reporting period, we noted an 8.3% decline in requests from the public.
ESDC completed 1,055 requests this reporting period. The completion rateFootnote 2 was 80.1%, which is lower than the government-wide rate of 85.1%. In 2013-2014, the completion rate for ESDC was 85.6%. ESDC also received 612 informal requests in 2014-2015 and 72.2% were completed within 30 days. The number of consultations received by ESDC from other federal government institutions decreased from 185 to 155, representing a decrease of 16.2% compared to 2013-2014.
ESDC processed 139,549 pages in 2014-2015, compared to 101,577 in 2013-2014. There was also an increase in the average number of pages processed per completed request increasing from 128 in 2013-2014 to 157 in 2014-2015 (see Table 1).
The information released by ESDC was mostly in paper format: 596 requests in paper compared to 140 requests in electronic format. The number of requests disclosed in paper format was similar to the results observed in the previous period (564 in paper and 152 in electronic format).
Table 1. Workload
| Measures | 2012-2013 | 2013-2014 | 2014-2015 |
|---|---|---|---|
| Number of requests received | 746 | 861 | 1,160 |
| Annual change (%) | - | 15.4% | 34.7% |
| Completed requests | 630 | 932 | 1,055 |
| Annual change (%) | - | 47.9% | 13.2% |
| Number of consultations received (from other government institutions) | 194 | 185 | 155 |
| Annual change (%) | - | -4.6% | -16.2% |
| Average number of pages processed per request completed | 205 | 128 | 157 |
| % of requests for which more than 1,000 pages were processed | 5.8% | 3.0% | 2.6% |
Request completion time
Timeliness
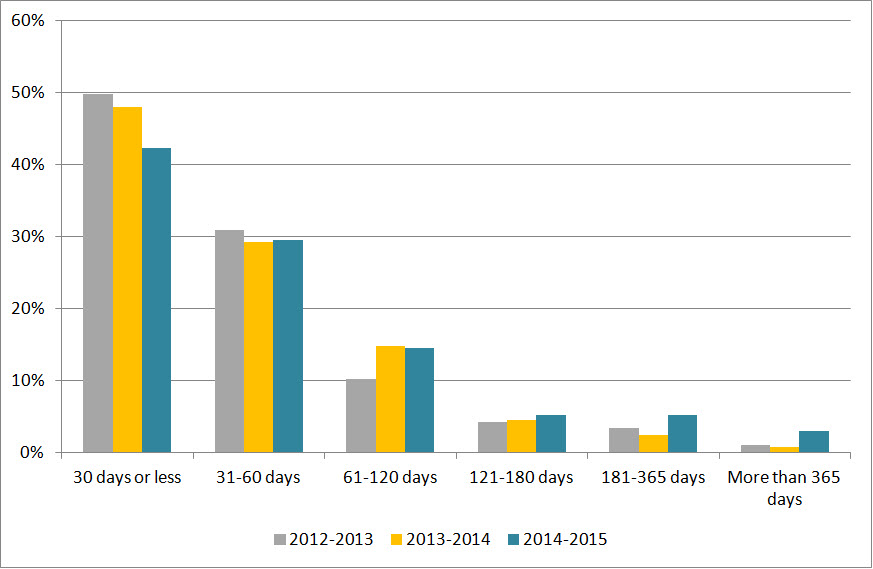
Figure 1 reveals that 42.4% of requests were completed within 30 days or less, which is a decrease of 5.6% from the previous period. In general, the results observed in 2014-2015 were similar to those of 2013-2014, except for delays of more than 180 days.
Figure 1: Request Completion Time
Text version
Figure 1 is a bar chart with vertical bars, representing the completion time by ESDC during each reporting period between 2012-2013 and 2014-2015. The results are as follows:
| Completion time | 2012-2013 | 2013-2014 | 2014-2015 |
|---|---|---|---|
| 30 days or less | 49.84% | 47.96% | 42.37% |
| 31-60 days | 30.95% | 29.29% | 29.57% |
| 61-120 days | 10.32% | 14.81% | 14.60% |
| 121-180 days | 4.29% | 4.61% | 5.21% |
| 181-365 days | 3.49% | 2.47% | 5.21% |
| More than 365 days | 1.11% | 0.86% | 3.03% |
Extensions
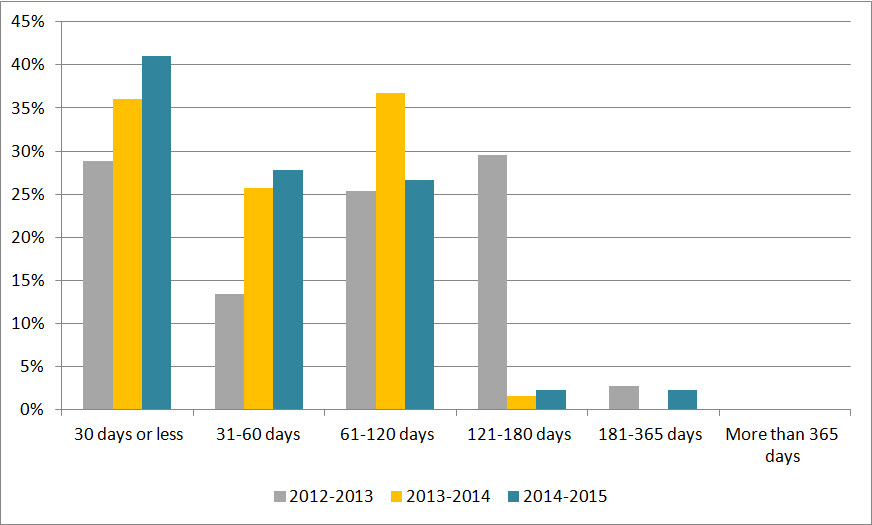
ESDC took a total of 356 extensions in 2014-2015 compared to 319 in 2013-2014. The most common reason for taking an extension was interference with operations (70.2%), followed by consultations (26.9%). Interference with operations was also the most common reason for extensions in 2013-2014.
Figure 2 shows that 41.0% of extensions were taken for less than 30 days, which represents a 5.0% increase from the previous reporting period. A significant change was observed in the number of extensions taken between 61 and 120 days, decreasing from 36.7% in 2013-2014 to 26.7% in 2014-2015.
Figure 2: Length of extensions
Text version
Figure 2 is a bar chart with vertical bars, representing the length of extensions taken by ESDC during each reporting period between 2012-2013 and 2014-2015. The results are as follows:
| Length of extensions | 2012-2013 | 2013-2014 | 2014-2015 |
|---|---|---|---|
| 30 days or less | 28.87% | 36.05% | 41.01% |
| 31-60 days | 13.38% | 25.71% | 27.81% |
| 61-120 days | 25.35% | 36.68% | 26.69% |
| 121-180 days | 29.58% | 1.57% | 2.25% |
| 181-365 days | 2.82% | 0.0% | 2.25% |
| More than 365 days | 0.0% | 0.0% | 0.0% |
Deemed refusals
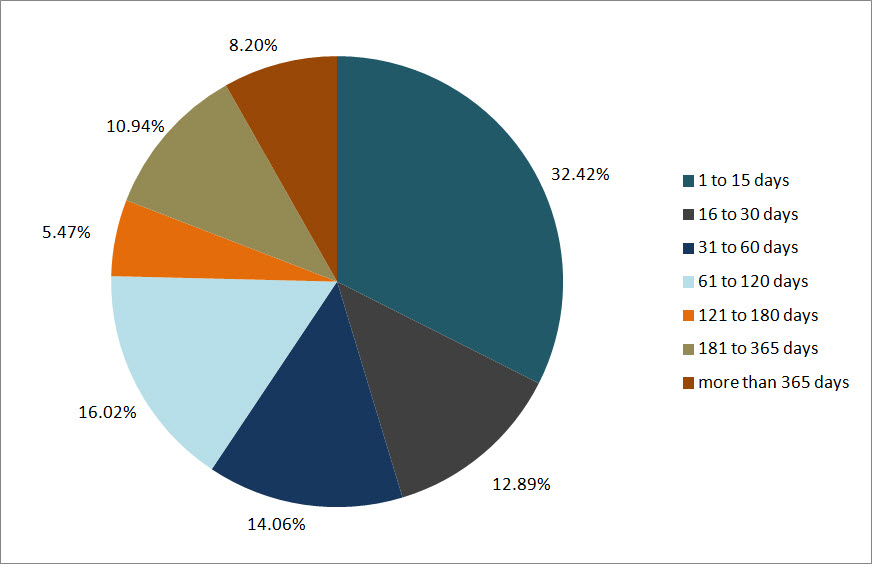
In 2014-2015, the number of requests closed past the statutory deadline was 256, which accounts for 24.2% of completed requests. This rate represents an “F” grade.Footnote 3 Compared to the previous year, ESDC’s grade dropped from a “B”.
We observed an increase of overdue requests over the past three years (49 in 2012-2013, 87 in 2013-2014, and 256 in 2014-2015). In its annual report to Parliament, ESDC attributes this increase to workload (71.9%). Figure 3 shows that 45.3% of overdue requests were late by 30 days or less in 2014-2015.
Figure 3: Lateness of overdue requests
Text version
Figure 3 is a pie chart, representing the delayed days for overdue requests taken by ESDC in 2014-2015. The results are as follows:
| Number of days | 2014-2015 |
|---|---|
| 1 to 15 days | 32.42% |
| 16 to 30 days | 12.89% |
| 31 to 60 days | 14.06% |
| 61 to 120 days | 16.02% |
| 121 to 180 days | 5.47% |
| 181 to 365 days | 10.94% |
| More than 365 days | 8.20% |
| Total | 100.0% |
Disclosure
Percentage of requests for which information was disclosed
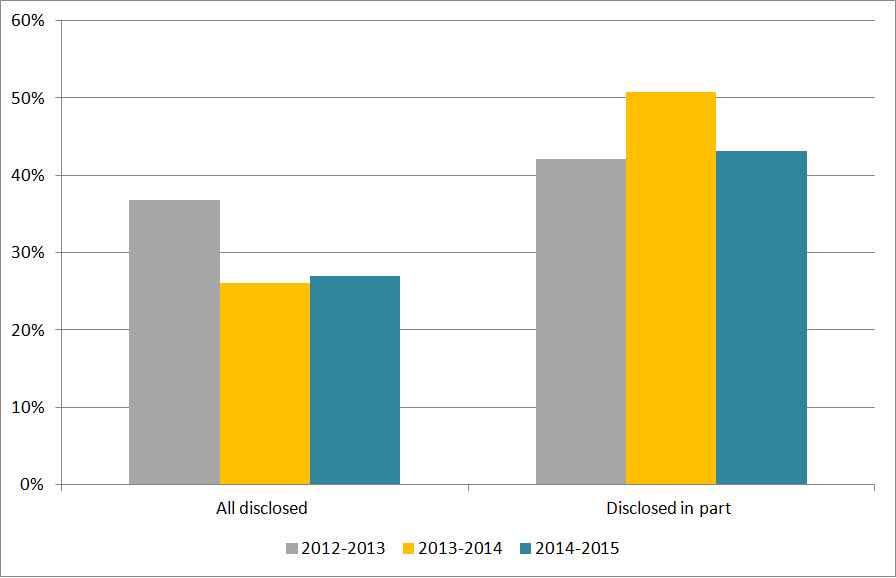
In 2014-2015, 27.0% of requests completed were entirely disclosed, which is similar to the previous period’s results (see Figure 4). Figure 4 also shows that the rate for partially disclosed requests was 43.1% in 2014-2015, which shows a decrease of 7.6% from the previous period.
Figure 4: Level of disclosure
Text version
Figure 4 is a bar-chart with vertical bars, representing the entirely disclosed and disclosed in part requests as proportion of total requests completed by ESDC during each reporting period between 2012-2013 and 2014-2015. The results are as follows:
| Disclosure | 2012-2013 | 2013-2014 | 2014-2015 |
|---|---|---|---|
| All disclosed | 36.83% | 26.07% | 27.01% |
| Disclosed in part | 42.06% | 50.75% | 43.13% |
Exemptions
The average number of exemptions used per completed request decreased slightly from 1.29 in 2013-2014 to 1.07 in 2014-2015 (see Table 2). The most frequent exemptions in 2014-2015 were section 19 (Personal Information) (30.7%), section 21 (Operations of Government) (17.9%), and section 16 (Law Enforcement and Investigations) (19.0%). In all three provisions, the number of exemptions increased respectively from 30.6%, 18.7% and 12.9% in 2013-2014.
Table 2: Exemptions
| Exemptions | 2012-2013 | 2013-2014 | 2014-2015 |
|---|---|---|---|
| Total number of exemptions | 684 | 1,202 | 1,129 |
| Total number of completed requests | 630 | 932 | 1,055 |
| Average number of exemptions per completed request | 1.09 | 1.29 | 1.07 |
Complaints at the OIC
The number of complaints receivedFootnote 4 against the ESDC decreased from 37 in 2013-2014 to 33 in this reporting period. The proportion of administrative complaints decreased from 67% to 45% compared to the previous reporting period. The number of well-founded complaints decreased from 20 to 15 compared to 2013-2014. Those discontinued and still pending resolution were 6 and 10, respectively.
Footnotes
- Footnote 1
-
Overall performance is based on the 2 primary indicators: Overall performance is based on two primary indicators: % of requests completed within 30 days, % of requests that were fully disclosed.
- Footnote 2
-
The completion rate was calculated using the number of received requests during the reporting period as well as outstanding requests from the previous period.
- Footnote 3
-
The 2007-2008 OIC report card grading system was used to estimate the grade A= 0 to 5%; B= 5 to 10%; C=10 to 15%, D= 15 to 20%, F=20% and more.
- Footnote 4
-
The numbers reported in this section are based on the OIC’s statistics. The information may not reflect the statistics reported by institutions due to the discrepancies in the methodology used.