2014-2015 Natural Resources Canada
Overall performanceFootnote 1
Natural Resources Canada (NRCan) a slight reduction of 2.8% in the number of requests received and observed a decrease of 5.5% in the percentage of requests completed within 30 days. This report provides comparative statistics for the last three periods (2012-2015).
Workload
NRCan received 670 requests under the Access to Information Act (the Act) which represents 1.0% of the requests received across government 2014-2015. This is a decrease of 2.8% compared to the number of requests received in 2013-2014. The majority of requests received originated from the public (38.2%). In fact, the public inventory of requests almost tripled compared to the previous period. We further observed a large decline of 85.5% in the number of requests from the media compared to 2013-2014.
NRCan completed 657 requests this reporting period. The completion rateFootnote 2 was 76.0%, which is below the government-wide rate of 85.1%. In 2013-2014, the completion rate for NRCan was 77.9%. NRCan also received 70 informal requests in 2014-2015 and 25.7% of these were completed within 30 days. The number of consultations received by NRCan from other federal government institutions decreased from 194 to 157, representing a decrease of 19.1% compared to 2013-2014.
The total number of pages processed this reporting period was 124,823 pages. This is two times higher than the previous period. The average number of pages processed per completed request increased from 109 pages in 2013-2014 to 217 in 2014-2015.
The information released by NRCan was mostly in paper format: 457 requests in paper format compared to 53 requests in electronic format.
Table 1: Workload
| Measures | 2012-2013 | 2013-2014 | 2014-2015 |
|---|---|---|---|
| Number of requests received | 769 | 689 | 670 |
| Annual change (%) | - | -10.4% | -2.8% |
| Completed requests | 687 | 685 | 657 |
| Annual change | - | -0.3% | -4.1% |
| Number of consultations received (from other government institutions) | 269 | 194 | 157 |
| Annual change (%) | - | -27.9% | -19.2% |
| Average number of pages processed per request completed | 160 | 109 | 217 |
| % of requests for which more than 1,000 pages were processed | 3.9% | 2.2% | 5.4% |
Request completion time
Timeliness
Figure 1 reveals that 44.3% of requests were completed within 30 days or less, which is 5.5% lower than the results observed in 2013-2014.
Figure 1: Request Completion Time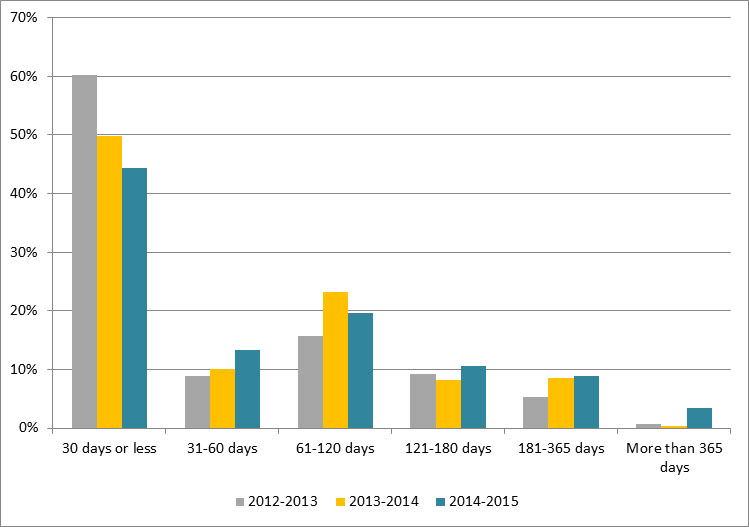
Text version
Figure 1 is a bar chart with vertical bars, representing the completion time by NRCan during each reporting period between 2012-2013 and 2014-2015. The results are as follows:
| Completion time | 2012-2013 | 2013-2014 | 2014-2015 |
|---|---|---|---|
| 30 days or less | 60.26% | 49.78% | 44.29% |
| 31-60 days | 8.88% | 10.07% | 13.24% |
| 61-120 days | 15.72% | 23.21% | 19.63% |
| 121-180 days | 9.17% | 8.18% | 10.65% |
| 181-365 days | 5.24% | 8.47% | 8.83% |
| More than 365 days | 0.73% | 0.29% | 3.35% |
Extensions
NRCan took a total of 422 extensions in 2014-2015 compared to 356 in 2013-2014. The most common reason for taking an extension was consultations (70.9%).
Figure 2 shows that 17.1% of extensions were taken for 30 days or less, which is 4.7% higher than the previous year. Figure 2 also shows that the number of extensions taken between 31 and 60 days in 2014-2015 increased by 4.7% while the number of extensions taken between 181-365 days decreased by 16.1% compared to 2013-2014.
Figure 2: Length of Extensions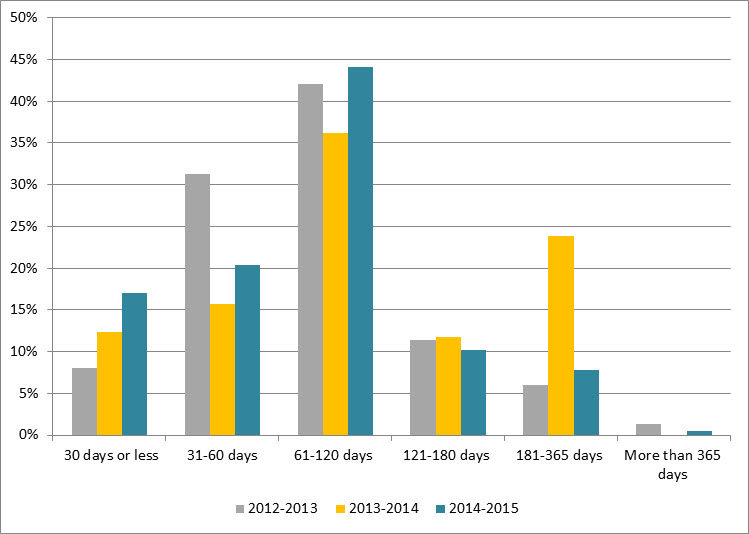
Text version
Figure 2 is a bar chart with vertical bars, representing the length of extensions taken by NRCan during each reporting period between 2012-2013 and 2014-2015. The results are as follows:
| Length of extensions in % | 2012-2013 | 2013-2014 | 2014-2015 |
|---|---|---|---|
| 30 days or less | 8.00% | 12.36% | 17.06% |
| 31-60 days | 31.33% | 15.73% | 20.38% |
| 61-120 days | 42.00% | 36.24% | 44.08% |
| 121-180 days | 11.33% | 11.80% | 10.19% |
| 181-365 days | 6.00% | 23.88% | 7.83% |
| More than 365 days | 1.33% | 0.00% | 0.47% |
Deemed refusals
In 2014-2015, the number of requests closed past the statutory deadline was 59, which accounts for 9.0% of completed requests. This rate represents a “B” grade.Footnote 3 The most common reason for overdue requests was workload (78.0%).
Figure 3 shows that 35.6% of overdue requests were late for 30 days or less, while 32.2% were late by more than 180 days. In the previous period, 14 requests were overdue of which 50.0% were late by 30 days or less.
Figure 3: Lateness of Overdue Requests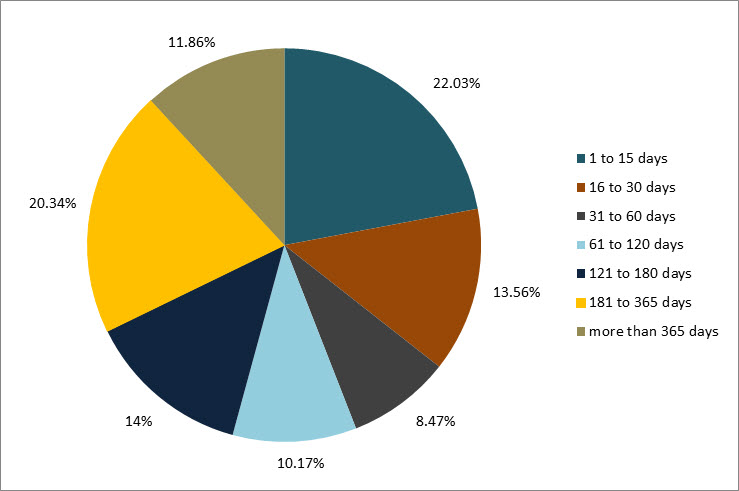
Text version
Figure 3 is a pie chart, representing the delayed days for overdue requests taken by NRCan during each reporting 2014-2015. The results are as follows:
| Number of days | 2014-2015 |
|---|---|
| 1 to 15 days | 22.03% |
| 16 to 30 days | 13.56% |
| 31 to 60 days | 8.47% |
| 61 to 120 days | 10.17% |
| 121 to 180 days | 13.56% |
| 181 to 365 days | 20.34% |
| more than 365 days | 11.86% |
| Total requests | 100,0% |
Disclosure
Percentage of requests for which information was disclosed
In 2014-2015, 23.3% of completed requests were entirely disclosed which represents an increase of 2.4% in comparison to the previous period (see Figure 4). Figure 4 also shows that the rate for partially disclosed requests was 54.3% in 2014-2015, which is an increase of 5.4% from the results of the previous period.
Figure 4: Level of Disclosure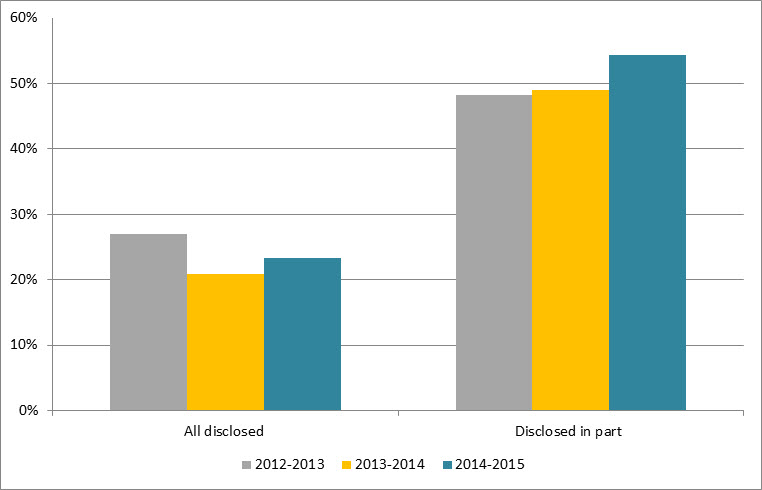
Text version
Figure 4 is a bar-chart with vertical bars, representing the entirely disclosed and disclosed in part requests as proportion of total requests completed by NRCan during each reporting period between 2012-2013 and 2014-2015. The results are as follows:
| Disclosure | 2012-2013 | 2013-2014 | 2014-2015 |
|---|---|---|---|
| All disclosed | 26.93% | 20.88% | 23.29% |
| Disclosed in part | 48.18% | 48.91% | 54.34% |
Exemptions
The average number of exemptions used per completed request was 1.79 in 2014-2015 compared to 1.32 in 2013-2014 (see Table 2). The most common exemptions in 2014-2015 were section 21 (Operations of Government) (41.0%), section 19 (Personal Information) (13.2%) and section 20 (Third-Party Information) (12.1%).
Table 2: Exemptions
| Exemptions | 2012-2013 | 2013-2014 | 2014-2015 |
|---|---|---|---|
| Total number of exemptions | 1,246 | 904 | 1,178 |
| Total number of completed request | 687 | 685 | 657 |
| Average number of exemptions per request | 1.81 | 1.32 | 1.79 |
Complaints at the OIC
In 2014-2015, the OIC received 35 complaintsFootnote 4 against NRCan compared to 38 complaints in 2013-2014. In the previous period, the number of administrative and refusal complaints were equal, while in this reporting period the number of refusal complaints increased by 18.7%.
From those received in 2014-2015, 28% were well-founded, which is a decrease of 19.3% compared to the previous period. Complaints discontinued and pending resolution were 4 and 18 respectively.
Footnotes
- Footnote 1
-
Overall performance is based on two primary indicators: % of requests completed within 30 days, % of requests that were fully disclosed.
- Footnote 2
-
The completion rate was calculated using the number of received requests during the reporting period as well as outstanding requests from the previous period.
- Footnote 3
-
The 2007-2008 OIC report card grading system was used to estimate the grade A= 0 to 5%; B= 5 to 10%; C=10 to 15%, D= 15 to 20%, F=20% and more.
- Footnote 4
-
The numbers reported in this section are based on the OIC’s statistics. The information may not reflect the statistics reported by institutions due to the discrepancies in the methodology used.