2014-2015 National Defence
Overall performanceFootnote 1
The Department of National Defence (ND) improved the percentage of requests completed within 30 days by 7.7%. There was a decrease of 5.8% of requests for which all information was disclosed. This report provides comparative statistics for the last three periods (2012-2015).
Workload
ND received 2,073 requests under the Access to Information Act (the Act), representing 3.0% of all requests received across government. The number of requests received by ND decreased by 7.1% compared to the previous period.
The majority of requests were from the public (42.6%) and the media (37.9%). Requests from the public increased by 48.8%, while those received from the media decreased by 29.0% compared to 2013-2014.
ND completed 2,015 requests this reporting period. This corresponds to a completion rateFootnote 2 of 76.5%, which is lower than the government-wide rate of 85.1%. ND also received 153 informal requests in 2014-2015, all of which were completed within 15 days. The number of consultations received by ND from other government institutions decreased from 394 to 370, representing a decrease of 6.1% compared to 2013-2014.
The total number of pages processed by ND this reporting period was 224,634, which is a decrease from 234,134 in 2013-2014. In contrast, the average number of pages processed per completed request increased from 123 in 2013-2014 to 130 in 2014-2015 (see Table 1).
The information released by ND in 2014-2015 was mostly in electronic format: 1,174 requests in electronic format compared to 11 requests in paper format. A significant shift from paper to electronic format is observed compared to 662 requests released in paper and 933 in electronic format in the previous period.
Table 1. Workload
| Measures | 2012-2013 | 2013-2014 | 2014-2015 |
|---|---|---|---|
| Number of requests received | 2,044 | 2,231 | 2,073 |
| Annual change (%) | - | 9.1% | -7.1% |
| Completed requests | 1,839 | 2,219 | 2,015 |
| Annual change (%) | - | 20,7% | -9.2% |
| Number of consultations received (from other government institutions) | 489 | 394 | 370 |
| Annual change (%) | - | -31.7% | 17.9% |
| Average number of pages processed per request completed | 104 | 123 | 130 |
| % of requests for which more than 1,000 pages were processed | 1.6% | 2.5% | 2.7% |
Request completion time
Timeliness
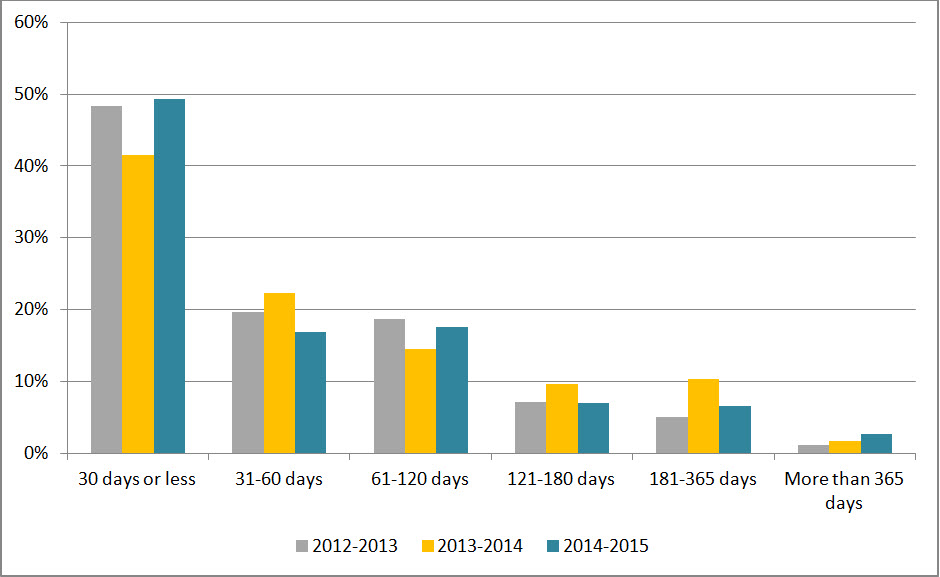
Figure 1 reveals that 49.3% of requests were completed within 30 days or less, which is an improvement from the 41.6% of requests completed within the 30-day statutory timeframe in 2013-2014.
Figure 1: Request Completion Time
Text version
Figure 1 is a bar chart with vertical bars, representing the completion time by ND during each reporting period between 2012-2013 and 2014-2015. The results are as follows:
| Completion time | 2012-2013 | 2013-2014 | 2014-2015 |
|---|---|---|---|
| 30 days or less | 48.29% | 41.55% | 49.33% |
| 31-60 days | 19.68% | 22.26% | 16.82% |
| 61-120 days | 18.71% | 14.56% | 17.52% |
| 121-180 days | 7.18% | 9.60% | 6.95% |
| 181-365 days | 5.00% | 10.27% | 6.65% |
| More than 365 days | 1.14% | 1.76% | 2.74% |
Extensions
ND took a total of 873 extensions in 2014-2015 compared to 1,462 in 2013-2014. The most common reason for taking an extension was interference with operations (55.6%), followed by consultations (39.2%). Similarly, interference with operations was the most common reason for extensions in 2013-2014.
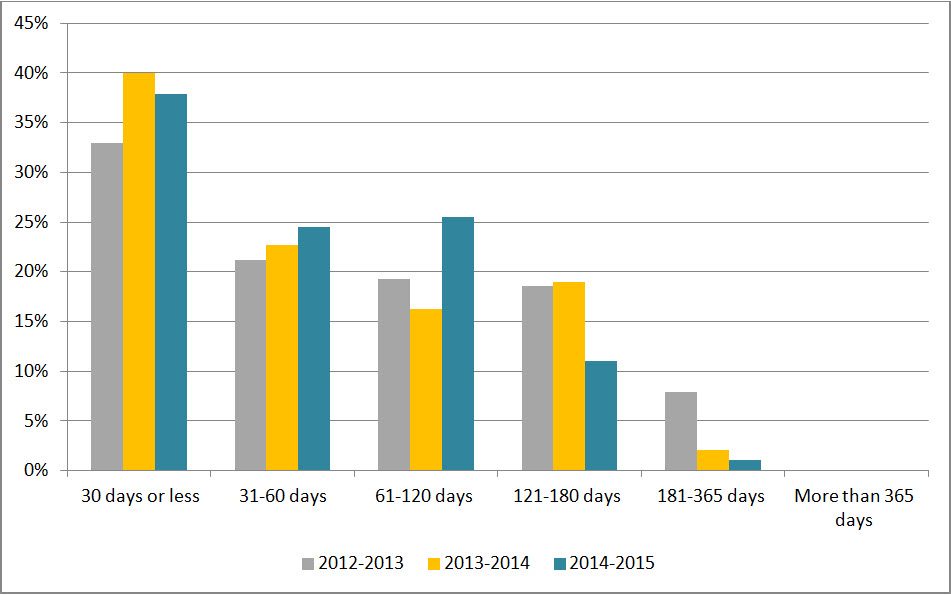
Figure 2 shows that 37.9% of extensions were taken for 30 days or less, which is 2.0% lower than 2013-2014. We also observed that the number of extensions taken between 31 and 60 days in 2014-2015 increased by 1.8% from the previous period.
Figure 2: Length of Extensions
Text version
Figure 2 is a bar chart with vertical bars, representing the length of extensions taken by ND during each reporting period between 2012-2013 and 2014-2015. The results are as follows:
| Length of extensions | 2012-2013 | 2013-2014 | 2014-2015 |
|---|---|---|---|
| 30 days or less | 32.97% | 39.95% | 37.92% |
| 31-60 days | 21.21% | 22.71% | 24.51% |
| 61-120 days | 19.30% | 16.28% | 25.54% |
| 121-180 days | 18.56% | 18.95% | 11.00% |
| 181-365 days | 7.95% | 2.05% | 1.03% |
| More than 365 days | 0.0% | 0.07% | 0.0% |
Deemed refusals
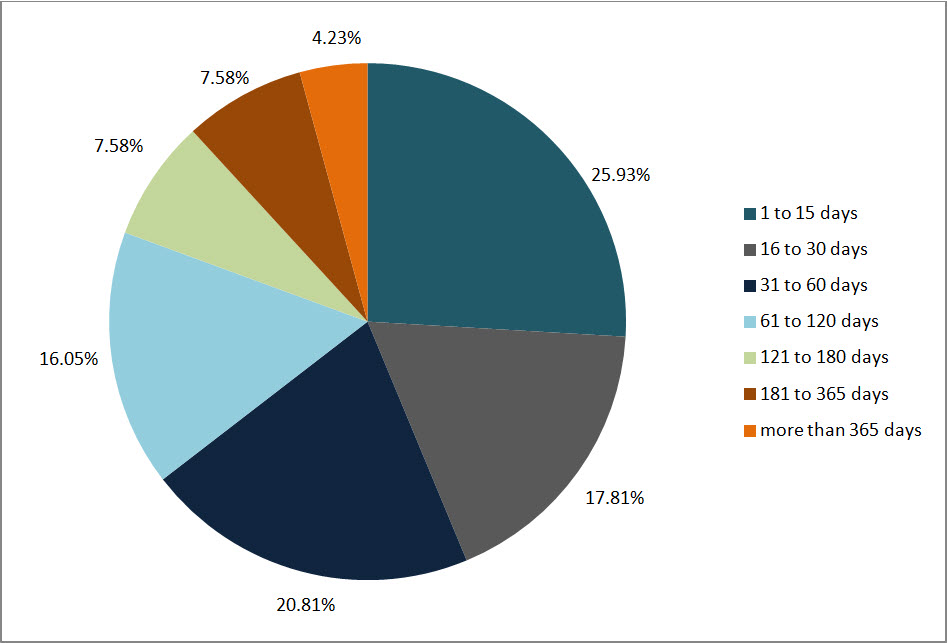
In 2014-2015, the number of requests closed past the statutory deadline was 567, which accounts for 28.1% of completed requests. This rate represents an “F” grade, which is a drop from the “B” (9.4%) of last year.Footnote 3 The reason provided for ND’s high rate of overdue requests was workload (57.3%). Figure 3 shows that 43.7% of overdue requests were late by 30 days or less.
Figure 3: Lateness of Overdue Requests
Text version
Figure 3 is a pie chart, representing the delayed days for overdue requests taken by ND in 2014-2015. The results are as follows:
| Number of days | 2014-2015 |
|---|---|
| 1 to 15 days | 25.93% |
| 16 to 30 days | 17.81% |
| 31 to 60 days | 20.81% |
| 61 to 120 days | 16.05% |
| 121 to 180 days | 7.58% |
| 181 to 365 days | 7.58% |
| More than 365 days | 4.23% |
| Total | 100.0% |
Disclosure
Percentage of requests for which information was disclosed
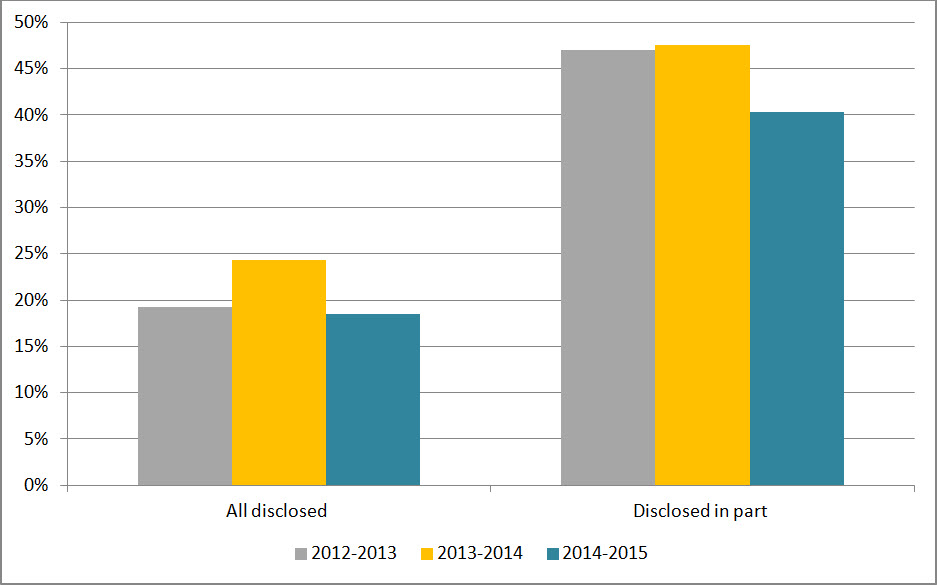
In 2014-2015, 18.5% of requests completed were entirely disclosed, which is the lowest disclosure rate since 2012 (see Figure 4). Figure 4 also shows that the rate for partially disclosed requests was 40.4% in 2014-2015, which decreased from 47.6% in 2013-2014.
Figure 4: Level of disclosure
Text version
Figure 4 is a pie chart, representing the entirely disclosed and disclosed in part requests as proportion of total requests completed by ND during each reporting period between 2012–2013 and 2014-2015. The results are as follows:
| Disclosure | 2012-2013 | 2013-2014 | 2014-2015 |
|---|---|---|---|
| All disclosed | 19.25% | 24.29% | 18.46% |
| Disclosed in part | 46.98% | 47.59% | 47.59% |
Exemptions
The average number of exemptions used per completed request decreased from 1.29 in 2013-2014 to 1.0 in 2014-2015 (see Table 2). The most used exemptions in 2014-2015 were section 19 (Personal Information) (24.4%), section 21 (Operations of Government) (22.4%), and section 15 (International Affairs and Defence) (21.4%).
Table 2: Exemptions
| Exemptions | 2012-2013 | 2013-2014 | 2014-2015 |
|---|---|---|---|
| Total number of exemptions | 2,015 | 2,870 | 2,045 |
| Total number of completed requests | 1,839 | 2,219 | 2,015 |
| Average number of exemptions per completed request | 1.10 | 1.29 | 1.01 |
Complaints at the OIC
The number of complaints receivedFootnote 4 against ND decreased from 119 in 2013-2014 to 117 in 2014-2015. The majority of complaints were refusals, accounting for 74.3% of all complaints. The number of administrative complaints decreased from 34.4% in 2013-2014 to 25.6% in this reporting period.
There was an increase of 26 well-founded complaints compared to the previous year. There were 18 complaints that were not well-founded, 25 that were discontinued and 41 that were still pending resolution.
Footnotes
- Footnote 1
-
Overall performance is based on two primary indicators: % of requests completed within 30 days, % of requests that were fully disclosed.
- Footnote 2
-
The completion rate was calculated using the number of received requests during the reporting period as well as outstanding requests from the previous period.
- Footnote 3
-
The 2007-2008 OIC report card grading system was used to estimate the grade A= 0 to 5%; B= 5 to 10%; C=10 to 15%, D= 15 to 20%, F=20% and more.
- Footnote 4
-
The numbers reported in this section are based on the OIC’s statistics. The information may not reflect the statistics reported by institutions due to the discrepancies in the methodology used.