2014-2015 Innovation, Science and Economic Development Canada
Overall performanceFootnote 1Footnote 2
Innovation, Science and Economic Development Canada (ISED) had fewer requests in 2014-2015 and also improved the percentage of requests completed within 30 days by 7.4% compared to 2013-2014. ISED also improved the percentage of requests fully disclosed by 32.3%. This report provides comparative statistics for the last three periods (2012-2015).
Workload
ISED received 749 requests under the Access to Information Act (the Act), representing 1.1% of total requests received government-wide in 2014-2015. This represents a decreased of 12.6% compared to the 857 requests received in the previous period. The majority of requests were from the media (51.3%) followed by the business sector (17.6%). The number of requests from media decreased by 28.0% compared to 2013-2014, while requests from other sectors increased.
ISED completed 705 requests this reporting period. The completion rateFootnotee 3 was 83.7%, which is slightly lower that the government-wide rate of 85.1%. In 2013-2014, the completion rate for ISED was 90.3%. ISED also received 197 informal requests, all of which were completed within 30 days. The number of consultations received by ISED from other federal government institutions decreased from 252 to 172, representing a decrease of 31.7% compared to 2013-2014.
The total number of pages processed in this reporting period was 1,354,646. The average number of pages processed per completed request decreased substantially from 9,649 in 2013-2014 to 2,265 in 2014-2015.
The information released by ISED was mostly in paper format: 289 requests in paper and 219 requests in electronic format. Compared to the previous period, there is a significant increase in the number of requests released in electronic format (264 in paper and 119 in electronic format in 2013-2014).
Table 1. Workload
| Measures | 2012-2013 | 2013-2014 | 2014-2015 |
|---|---|---|---|
| Number of requests received | 741 | 857 | 749 |
| Annual change (%) | - | 15.7% | -12.6% |
| Completed requests | 860 | 865 | 705 |
| Annual change (%) | - | 0.6% | -18.5% |
| Number of consultations received (from other government institutions) | 770 | 252 | 172 |
| Annual change (%) | - | -67.3% | -31.7% |
| Average number of pages processed per request completed | 5,050 | 9,649 | 2,265 |
| % of requests for which more than 1,000 pages were processed | 13.4% | 4.6% | 3.5% |
Request completion time
Timeliness
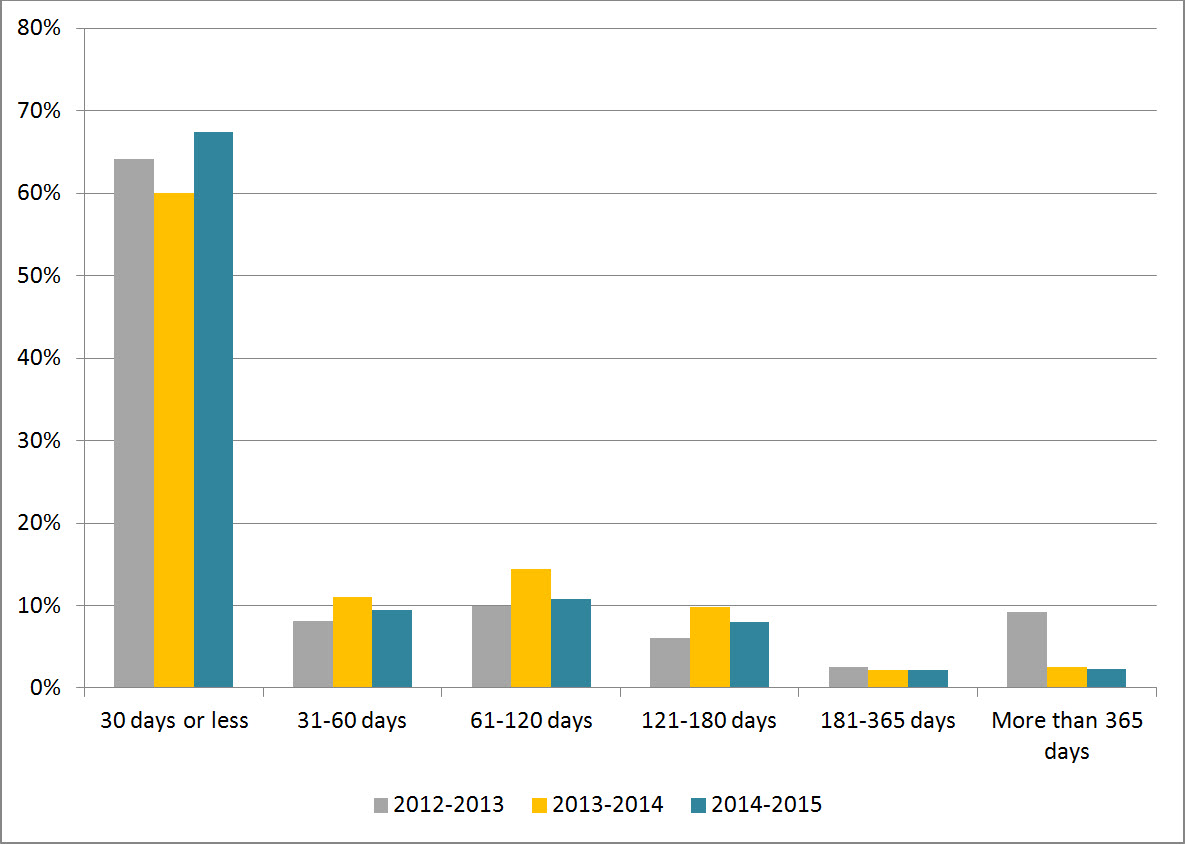
Figure 1 reveals that 67.4% of requests were completed within 30 days or less, which is 7.4% higher than the results observed in 2013-2014. We note a small decline in all other periods.
Figure 1: Request Completion Time
Text version
Figure 1 is a bar chart with vertical bars, representing the completion time by ISED during each reporting period between 2012-2013 and 2014-2015. The results are as follows:
| Completion time | 2012-2013 | 2013-2014 | 2014-2015 |
|---|---|---|---|
| 30 days or less | 64.91% | 60.00% | 67.38% |
| 31-60 days | 8.14% | 10.98% | 9.50% |
| 61-120 days | 9.88% | 14.45% | 10.78% |
| 121-180 days | 6.05% | 9.83% | 7.94% |
| 181-365 days | 2.56% | 2.20% | 2.13% |
| More than 365 days | 9.19% | 2.54% | 2.27% |
Extensions
ISED took a total of 313 extensions in 2014-2015 compared to 466 in 2013-2014. The most common reason for taking an extension was consultations (61.7%), followed by third-party notice (20.4%).
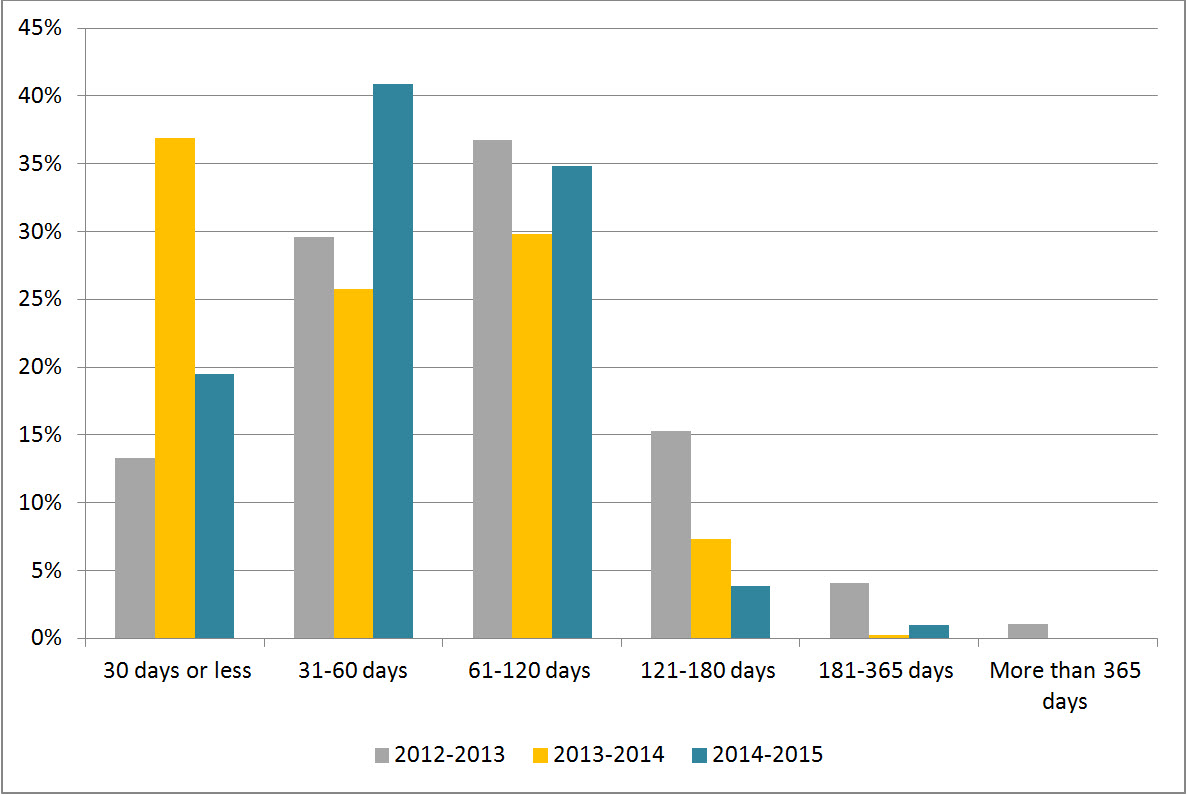
Figure 2 shows that 19.5% of extensions were taken for less than 30 days, which represents a decrease of 17.4% from 2013-2014. Figure 2 also indicates that the number of extensions taken between 31 and 60 days increased by 15.1% compared to the previous period and that the number of extensions taken between 121 and 180 days decreased by 3.5%.
Figure 2: Length of Extensions
Text version
Figure 2 is a bar chart with vertical bars, representing the length of extensions taken by ISED during each reporting period between 2012-2013 and 2014-2015. The results are as follows:
| Length of extensions | 2012-2013 | 2013-2014 | 2014-2015 |
|---|---|---|---|
| 30 days or less | 13.27% | 36.91% | 19.49% |
| 31-60 days | 29.59% | 25.75% | 40.89% |
| 61-120 days | 36.73% | 29.83% | 34.82% |
| 121-180 days | 15.31% | 7.30% | 3.83% |
| 181-365 days | 4.08% | 0.21% | 0.96% |
| More than 365 days | 1.02% | 0.00% | 0.00% |
Deemed refusals
In 2014-2015, the number of requests closed past the statutory deadline was 37, which accounts for 5.2% of completed requests. This rate represents a “B” grade.Footnote 4 The main reason for not meeting the statutory deadline was workload (81.1%), followed by other reasons (16.2%).
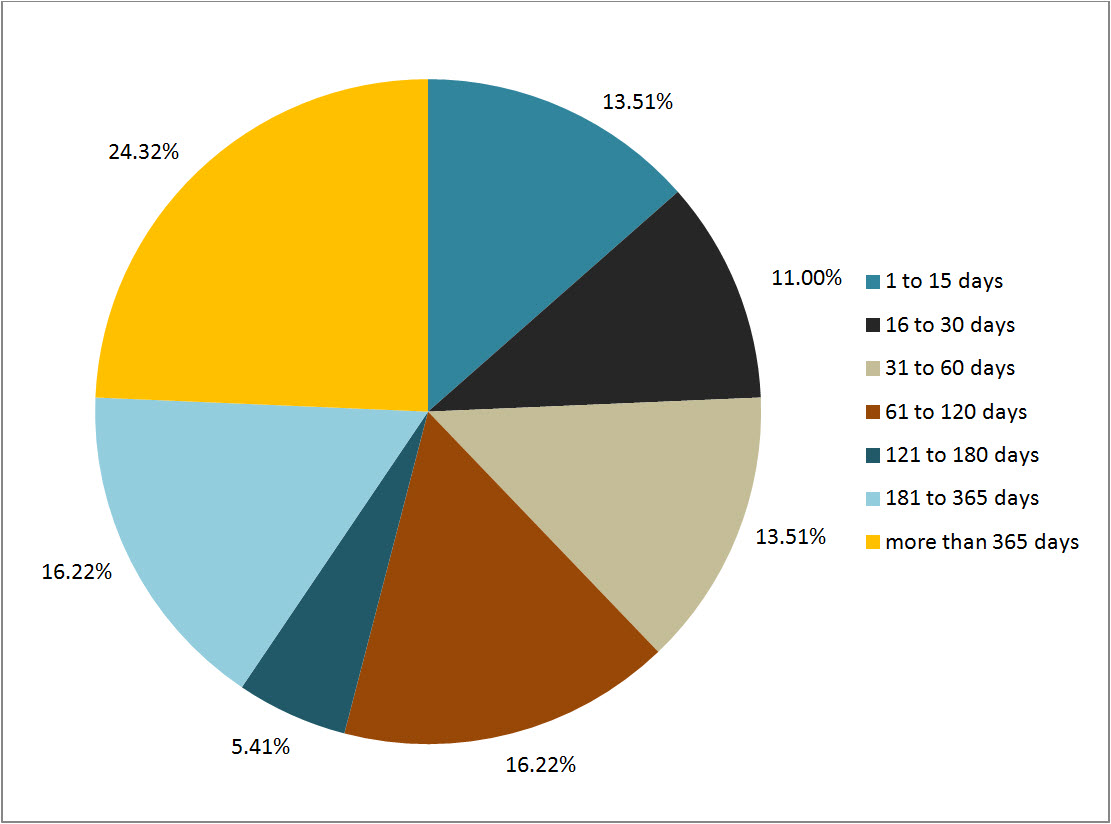
Figure 3 shows that 24.3% were late by 30 days or less and that 40.5% of overdue requests were late by more than 180 days. We note that 24.3% of overdue requests were late more than 365 days, despite the fact that no extensions were taken for more than that length of time.
Figure 3: Lateness of Overdue Requests
Text version
Figure 3 is a pie chart, representing the delayed days for overdue requests taken by ISED in 2014-2015. The results are as follows:
| Number of days | 2014-2015 |
|---|---|
| 1 to 15 days | 13.51% |
| 16 to 30 days | 11.00% |
| 31 to 60 days | 13.51% |
| 61 to 120 days | 16.22% |
| 121 to 180 days | 5.41% |
| 181 to 365 days | 16.22% |
| More than 365 days | 24.32% |
| Total | 100.0% |
Disclosure
Percentage of requests for which information was disclosed
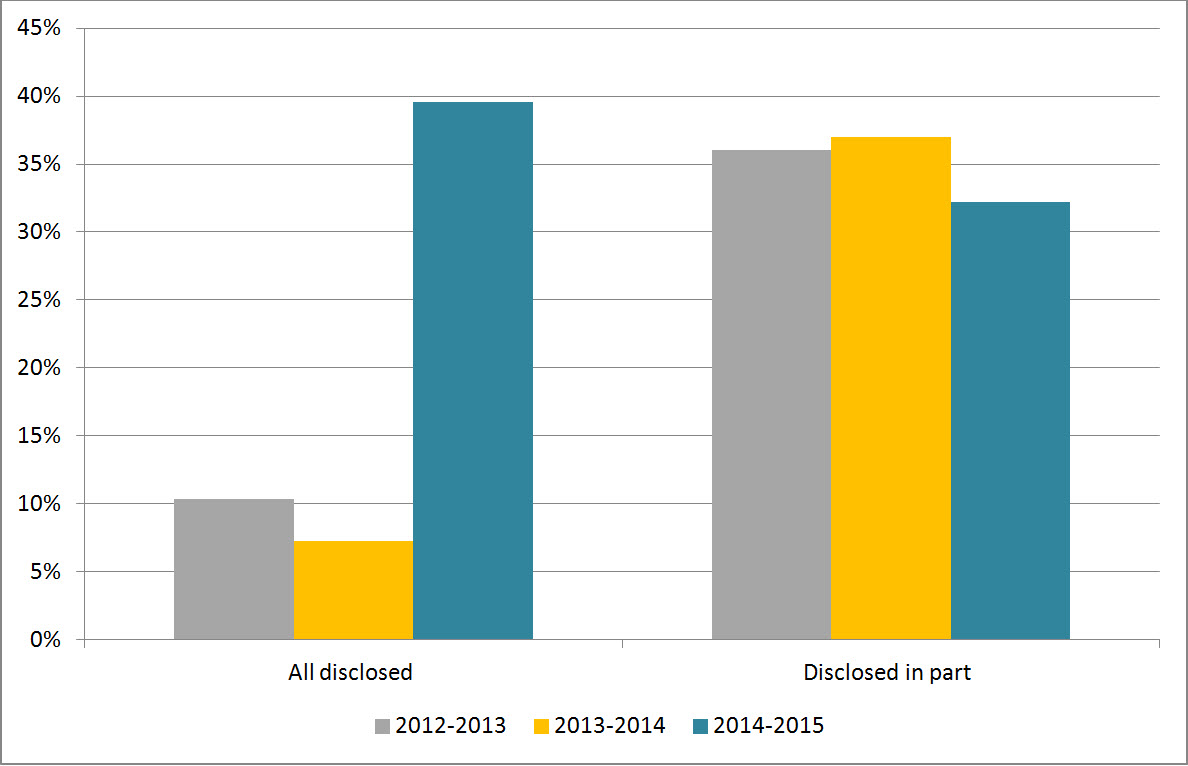
In 2014-2015, 39.6% of completed requests were entirely disclosed which is significantly higher compared to 7.3% in 2013-2014. The proportion of partially disclosed requests decreased by 4.8% compared to 2013-2014 (37.0% in 2013-2014 and 32.2% in 2014-2015).
Figure 4: Level of Disclosure
Text version
Figure 4 is a bar-chart with vertical bars, representing the entirely disclosed and disclosed in part requests as proportion of total requests completed by ISED during each reporting period between 2012-2013 and 2014-2015. The results are as follows:
| Disclosure | 2012-2013 | 2013-2014 | 2014-2015 |
|---|---|---|---|
| All disclosed | 10.35% | 7.28% | 39.57% |
| Disclosed in part | 36.05% | 36.99% | 32.20% |
Exemptions
ISED applied 769 exemptions in 2014-2015 compared to 1,011 the previous year. We observed a decrease in the average number of exemptions used per completed request compared to the previous period (1.17 in 2013-2014 to 1.09 in 2014-2015) (see Table 2).
The most common exemptions used in 2014-2015 were section 21 (Operations of Government) (41.9%), followed by section 20 (Third-Party Information) (19.5%) and section 19 (Personal Information) (14.6%). We observed that exemptions applied according to the aforementioned provisions decreased from the previous period.
Table 2: Exemptions
| Exemptions | 2012-2013 | 2013-2014 | 2014-2015 |
|---|---|---|---|
| Total number of exemptions | 1,367 | 1,011 | 769 |
| Total number of completed requests | 860 | 865 | 705 |
| Average number of exemptions per completed request | 1.59 | 1.17 | 1.09 |
Complaints at the OIC
The OIC received 11 complaintsFootnote 5 against ISED in 2014-2015, which is a substantial decrease compared to the 42 complaints received in the previous reporting period. Similar to the last period, most of the complaints were refusals.
In this reporting period, the OIC received 8 refusal and 3 administrative complaints, compared to 36 refusal and 6 administrative complaints in 2013-2014. Out of those 11 complaints, 2 were well-founded, 2 were not well-founded, 6 were discontinued and 1 was pending resolution.
Footnotes
- Footnote 1
-
Industry Canada was changed to Innovation, Science and Economic Development.
- Footnote 2
-
Overall performance is based on two primary indicators: % of requests completed within 30 days, % of requests that were fully disclosed.
- Footnote 3
-
The completion rate was calculated using the number of received requests during the reporting period as well as outstanding requests from the previous period.
- Footnote 4
-
The 2007-2008 OIC report card grading system was used to estimate the grade A= 0 to 5%; B= 5 to 10%; C=10 to 15%, D= 15 to 20%, F=20% and more.
- Footnote 5
-
The numbers reported in this section are based on the OIC’s statistics. The information may not reflect the statistics reported by institutions due to the discrepancies in the methodology used.