2014-2015 Health Canada
Overall performanceFootnote 1
Health Canada (HC) improved the percentage of requests completed within 30 days by 3.5%. This report provides comparative statistics for the last three periods (2012-2015).
Workload
HC received 1,569 requests under the Access to Information Act (the Act), representing 2.3% of total requests received across government in 2014-2015. In 2013-2014, HC received a similar number of requests (1,563).
The majority of the requests received by HC were from the business sector (53.3%), followed by the public (25.0%). A decrease of 18.0% was observed in requests from organizations compared to the last period.
HC completed 1,420 requests this reporting period. The completion rateFootnote 2 was 62.5%, which is lower than the government-wide rate of 85.1%. In 2013-2014, the completion rate for HC was 67.3%. HC also received 314 informal requests and 27.3% of these were completed within 30 days. The number of consultations received by HC from other government institutions increased from 154 to 160, representing an increase of 3.9% compared to 2013-2014.
In 2014-2015, HC processed 205,132 pages. The average number of pages processed per completed request decreased only marginally from 167 in 2013-2014 to 165 in 2014-2015.
The information released by HC was mostly in paper format: 629 requests in paper format and 246 requests in electronic format. This is similar compared to the last year (732 requests in paper format and 246 requests in electronic format).
Table 1. Workload
| Measures | 2012-2013 | 2013-2014 | 2014-2015 |
|---|---|---|---|
| Number of requests received | 1,765 | 1,563 | 1,569 |
| Annual change (%) | - | -11.4% | 0.4% |
| Completed requests | 1,689 | 1,446 | 1,420 |
| Annual change (%) | - | -14.4% | -1.8% |
| Number of consultations received (from other government institutions) | 186 | 154 | 160 |
| Annual change (%) | - | -17.2% | 3.9% |
| Average number of pages processed per request completed | 274 | 167 | 165 |
| % of requests for which more than 1,000 pages were processed | 5.6% | 3.6% | 3.7% |
Request completion time
Timeliness
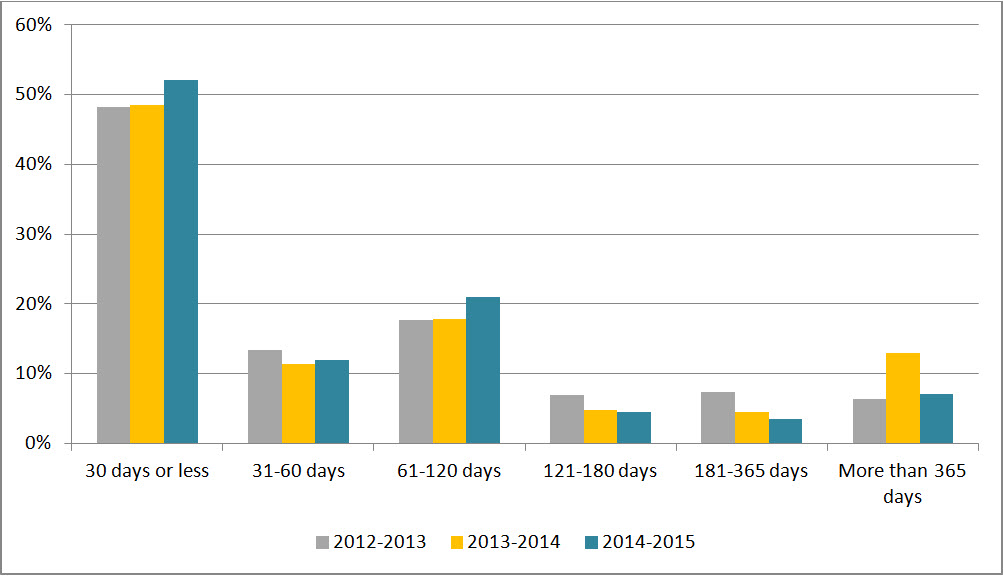
Figure 1 reveals that 52.0% of requests were completed within 30 days or less, which is an increase of 3.5% from 2013-2014. We note that the number of requests completed between 61 and 120 days increased by 3.1% while requests that took beyond 365 days to complete dropped by 5.9%.
Figure 1: Request Completion Time
Text version
Figure 1 is a bar chart with vertical bars, representing the completion time by HC during each reporting period between 2012-2013 and 2014-2015. The results are as follows:
| Completion time | 2012-2013 | 2013-2014 | 2014-2015 |
|---|---|---|---|
| 30 days or less | 48.19% | 48.48% | 52.04% |
| 31-60 days | 13.38% | 11.41% | 11.90% |
| 61-120 days | 17.70% | 17.84% | 20.92% |
| 121-180 days | 6.93% | 4.77% | 4.51% |
| 181-365 days | 7.40% | 4.50% | 3.52% |
| More than 365 days | 6.39% | 13.00% | 7.11% |
Extensions
HC took a total of 694 extensions in 2014-2015 compared to 719 in 2013-2014. The most common reason for taking an extension was third-party notice (49.6%), followed by interference with operations (26.8%), and consultations (23.6%).
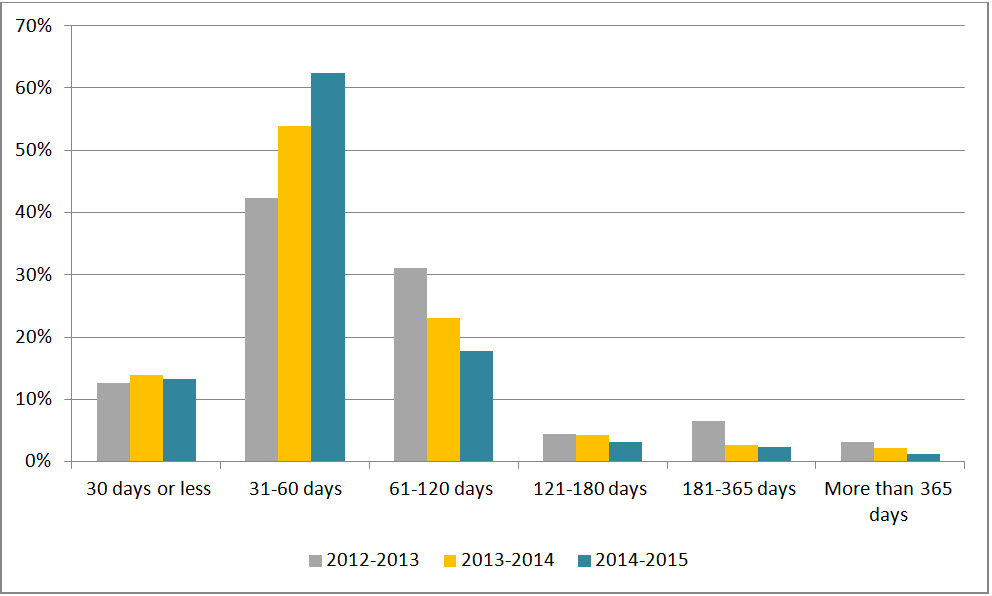
Figure 2 shows that 13.3% of the extensions taken in 2014-2015 were for 30 days or less, which is marginally higher (0.7%) compared to 2013-2014. Figure 2 also shows that the number of extensions taken between 31 and 60 days in increased by 8.6% compared to 2013-2014. In all other categories, the lengths of extensions were reduced, with the exception of the 181 to 365 day category, where they remained the same.
Figure 2: Length of Extensions
Text version
Figure 2 is a bar chart with vertical bars, representing the length of extensions taken by HC during each reporting period between 2012-2013 and 2014-2015. The results are as follows:
| Length of extensions | 2012-2013 | 2013-2014 | 2014-2015 |
|---|---|---|---|
| 30 days or less | 12.55% | 13.91% | 13.26% |
| 31-60 days | 42.40% | 53.82% | 62.39% |
| 61-120 days | 31.04% | 23.09% | 17.72% |
| 121-180 days | 4.36% | 4.31% | 3.17% |
| 181-365 days | 6.47% | 2.64% | 2.31% |
| More than 365 days | 3.17% | 2.23% | 1.15% |
Deemed refusals
In 2014-2015, the number of requests closed past the statutory deadline was 207, which accounts for 14.5% of all completed requests. This rate represents a “C” grade.Footnote 3 The main reason for not meeting the statutory deadline was workload (72.2%), followed by other reasons (13.5%).Footnote 4
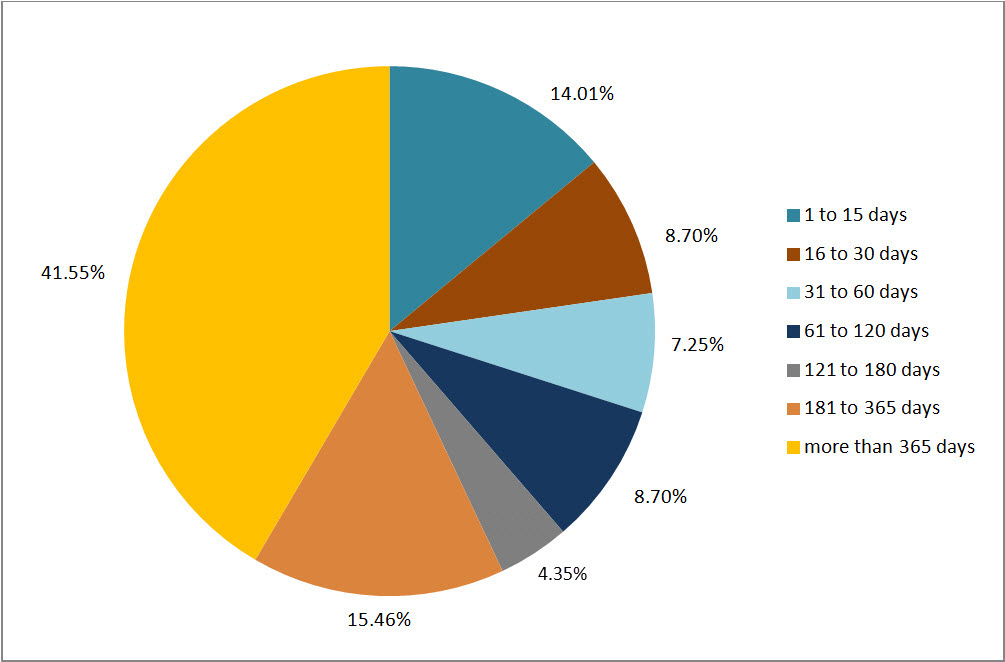
Although the number of overdue requests decreased by 41.0% compared to the previous period, 57.0% of overdue requests were late more than 180 days, and only 22.7% were late by 30 days and less (see Figure 3). Compared to 2013-2014, there is a marginal decrease of 1.1% in the number of overdue requests that were late for more than 180 days.
Figure 3: Lateness of Overdue Requests
Text version
Figure 3 is a pie chart, representing the delayed days for overdue requests taken by HC in 2014-2015. The results are as follows:
| Number of days | 2014-2015 |
|---|---|
| 1 to 15 days | 14.01% |
| 16 to 30 days | 8.70% |
| 31 to 60 days | 7.25% |
| 61 to 120 days | 8.70% |
| 121 to 180 days | 4.35% |
| 181 to 365 days | 15.46% |
| More than 365 days | 41.55% |
| Total | 100.0% |
Disclosure
Percentage of requests for which information was disclosed
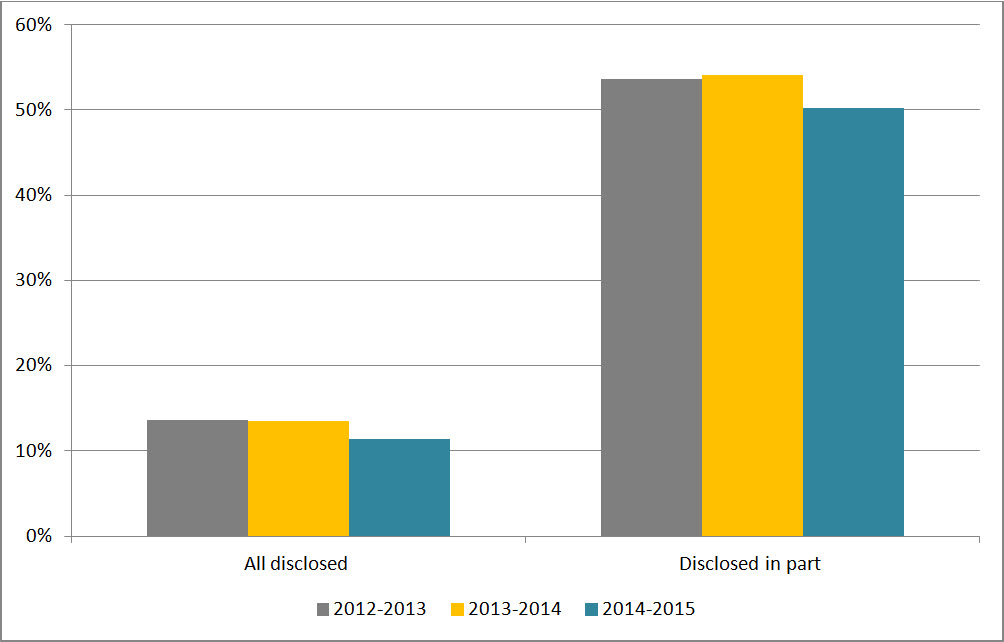
In 2014-2015, 11.3% of requests completed were entirely disclosed, which represents a decrease of 2.15% from the previous period (see Figure 4). Figure 4 also shows that the rate for partially disclosed requests was 50.3% in 2014-2015, which is 3.9% lower than the previous period.
Figure 4: Level of Disclosure
Text version
Figure 4 is a bar-chart with vertical bars, representing the entirely disclosed and disclosed in part requests as proportion of total requests received by HC during each reporting period between 2012-2013 and 2014-2015. The results are as follows:
| Disclosure | 2012-2013 | 2013-2014 | 2014-2015 |
|---|---|---|---|
| All disclosed | 13.56% | 13.49% | 11.34% |
| Disclosed in part | 53.64% | 54.15% | 50.28% |
Exemptions
The average number of exemptions used per completed request decreased marginally from 1.2 in 2013-2014 to 1.1 in 2014-2015 (see Table 2). The most used exemptions for this reporting period were section 19 (Personal Information) (41.5%), followed by section 20 (Third-Party Information) (25.9%) and section 21 (Operations of Government) (13.4%) in 2014-2015.
Table 2: Exemptions
| Exemptions | 2012-2013 | 2013-2014 | 2014-2015 |
|---|---|---|---|
| Total number of exemptions | 2,148 | 1,730 | 1,592 |
| Total number of completed requests | 1,689 | 1,446 | 1,420 |
| Average number of exemptions per completed request | 1.27 | 1.20 | 1.12 |
Complaints at the OIC
The number of complaints receivedFootnote 5 against HC increased from 48 in 2013-2014 to 65 in 2014-2015. The number of administrative complaints was 26, which is similar to 2013-2014, while the number of refusal complaints increased from 22 to 39. In 2014-2015, 24 complaints were well-founded resolved, 16 were discontinued and 23 were pending resolution.
Footnotes
- Footnote 1
-
Overall performance is based on two primary indicators: % of requests completed within 30 days, % of requests that were fully disclosed.
- Footnote 2
-
The completion rate was calculated using the number of received requests during the reporting period as well as outstanding requests from the previous period.
- Footnote 3
-
The 2007-2008 OIC report card grading system was used to estimate the grade A= 0 to 5%; B= 5 to 10%; C=10 to 15%, D= 15 to 20%, F=20% and more.
- Footnote 4
-
In its annual report on the administration of the Act, HC explained that a significant number of requests require several complex third party consultations to identify confidential business information requiring protection. These records often involve large volumes of technical and scientific information, which can take additional time to review.
- Footnote 5
-
The numbers reported in this section are based on the OIC’s statistics. The information may not reflect the statistics reported by institutions due to the discrepancies in the methodology used.