2014-2015 Global Affairs Canada
Overall PerformanceFootnote 1Footnote 2
In 2014-2015, Global Affairs Canada (GAC)Footnote 3 experienced a decrease of 24.9% in the number of requests received. The percentage of requests completed within 30 days decreased by 0.1%. This report provides comparative statistics for the last three periods (2012-2015).
Workload
GAC received 871 requests under the Access to Information Act (the Act), which represents 1.3% of total requests received across government in 2014-2015. The majority of requests received were from the media (54.8%) and the public (21.0%). The number of requests received from organizations dropped by 45.2% compared to the previous period.
GAC completed 984 requests this reporting period, which is more than the number of requests it received. The completion rateFootnote 4 was 71.9%, which is lower than the government-wide rate of 85.1%. In 2013-2014, the completion rate for GAC was 54.7%. GAC also received 744 informal requests in 2014-2015 and 42.2% of these were completed within 30 days. The number of consultations received by GAC from other federal government institutions decreased from 898 to 645, representing a decrease of 28.2% compared to 2013-2014.
The total number of pages processed by GAC was 156,160. The average number of pages processed per completed request increased from 162 in 2013-2014 to 183 in 2014-2015.
The information released by GAC was mostly in paper format: 382 in paper format and 253 requests in electronic format.
Table 1: Workload
| Measures | 2012-2013 | 2013-2014 | 2014-2015 |
|---|---|---|---|
| Number of requests received | 1,148 | 1,159 | 871 |
| Annual change (%) | - | 1.0% | -24.8% |
| Completed requests | 1,033 | 1,290 | 984 |
| Annual change (%) | - | 24.9% | -23.7% |
| Number of consultations received (from other government institutions) | 1,057 | 898 | 645 |
| Annual change (%) | - | -15.0% | -28.2% |
| Average number of pages processed per request completed | - | 162 | 183 |
| % of requests for which more than 1,000 pages were processed | 2.0% | 3.5% | 3.6% |
Requests completion time
Timeliness
Figure 1 demonstrates that 33.7% of GAC’s requests were completed within 30 days or less, which is similar to the results observed in 2013-2014 (33.8%). We note that the number of requests completed between 31 and 365 days decreased from the previous period, whereas the percentage of completed requests that took more than 365 days increased by 6.8%.
Figure 1: Request Completion Time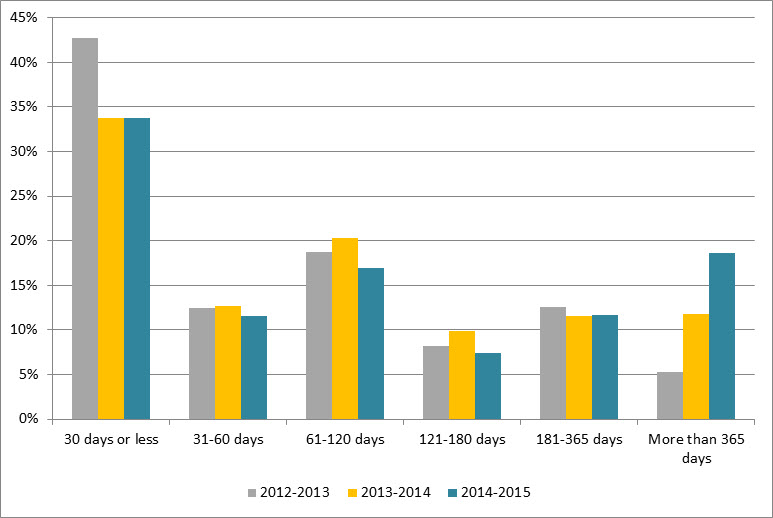
Text version
Figure 1 is a bar chart with vertical bars, representing the completion time by GAC during each reporting period between 2012-2013 and 2014-2015. The results are as follows:
| Completion time | 2012-2013 | 2013-2014 | 2014-2015 |
|---|---|---|---|
| 30 days or less | 42.69% | 33.80% | 33.74% |
| 31-60 days | 12.49% | 12.64% | 11.59% |
| 61-120 days | 18.78% | 20.31% | 16.97% |
| 121-180 days | 8.23% | 9.92% | 7.42% |
| 181-365 days | 12.53% | 11.55% | 11.69% |
| More than 365 days | 5.23% | 11.78% | 18.60% |
Extensions
GAC took a total of 651 extensions in 2014-2015 compared to 843 in 2013-2014. The most common reason for taking an extension was consultations (69.6%), followed by interference with operations (21.8%).
Figure 2 shows that 24.6% of extensions were taken for 30 days or less. This measure is similar compared to 2013-2014. Figure 2 also shows that the number of requests extended between 31 and 60 days in 2014-2015 increased by 2.4% compared to the previous period.
Figure 2: Length of Extensions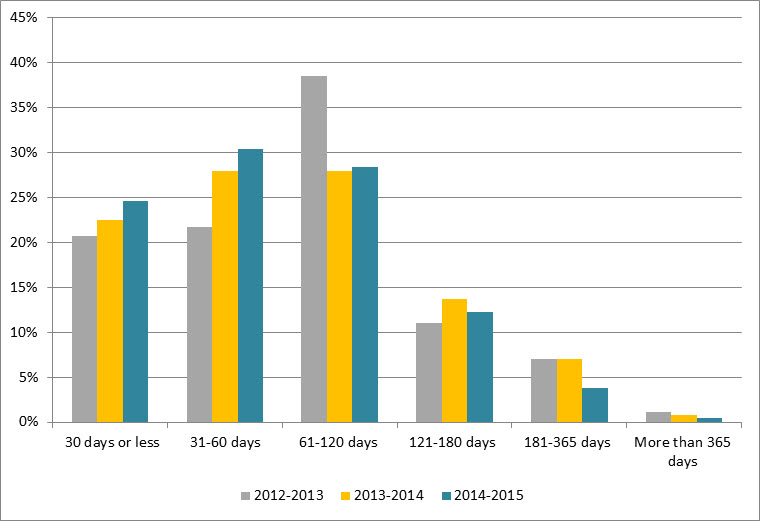
Text version
Figure 2 is a bar chart with vertical bars, representing the length of extensions taken by GAC during each reporting period between 2012-2013 and 2014-2015. The results are as follows:
| Length of extensions in % | 2012-2013 | 2013-2014 | 2014-2015 |
|---|---|---|---|
| 30 days or less | 20.67% | 22.53% | 24.58% |
| 31-60 days | 21.67% | 27.99% | 30.41% |
| 61-120 days | 38.50% | 27.99% | 28.42% |
| 121-180 days | 11.00% | 13.64% | 12.29% |
| 181-365 days | 7.00% | 7.00% | 3.84% |
| More than 365 days | 1.17% | 0.83% | 0.46% |
Deemed refusals
In 2014-2015, the number of requests closed past the statutory deadline was 407, which accounts for 41.4% of completed requests. This rate represents an “F” grade. Footnote 5 The most common reason for overdue requests was workload (58.2%), followed by consultations (23.1%) and other reasons (18.7%).
Figure 3 shows that 52.3% of overdue requests were more than 181 days late, while only 18.9% were late by 30 days or less.
Figure 3: Lateness of Overdue Requests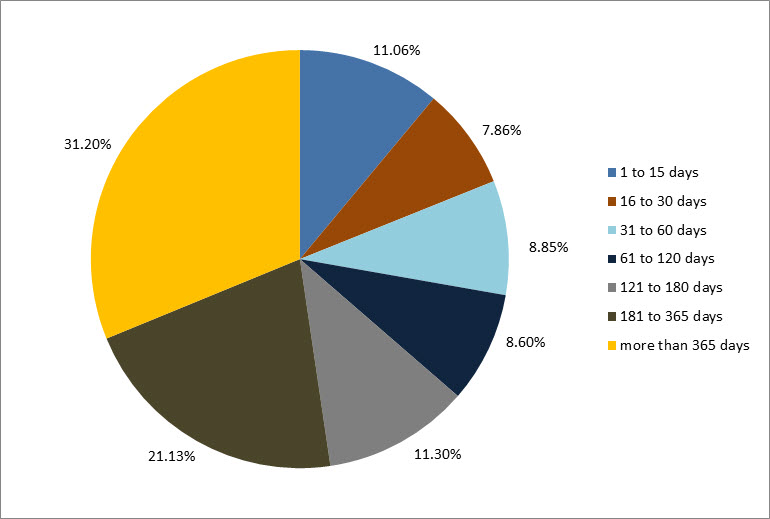
Text version
Figure 3 is a pie chart, representing the delayed days for overdue requests taken by GAC in 2014-2015. The results are as follows:
| Number of days | 2014-2015 |
|---|---|
| 1 to 15 days | 11.06% |
| 16 to 30 days | 7.86% |
| 31 to 60 days | 8.85% |
| 61 to 120 days | 8.60% |
| 121 to 180 days | 11.30% |
| 181 to 365 days | 21.13% |
| more than 365 days | 31.20% |
| Total | 100.0% |
Disclosure
Percentage of requests for which information was disclosed
In 2014-2015, 9.2% of completed requests were entirely disclosed which represents a slight decrease of 0.6% from the previous period (see Figure 4). Figure 4 also shows that the rate for partially disclosed requests was 58.4% in 2014-2015, which is 3.3% lower than the results of the previous period.
Figure 4: Level of Disclosure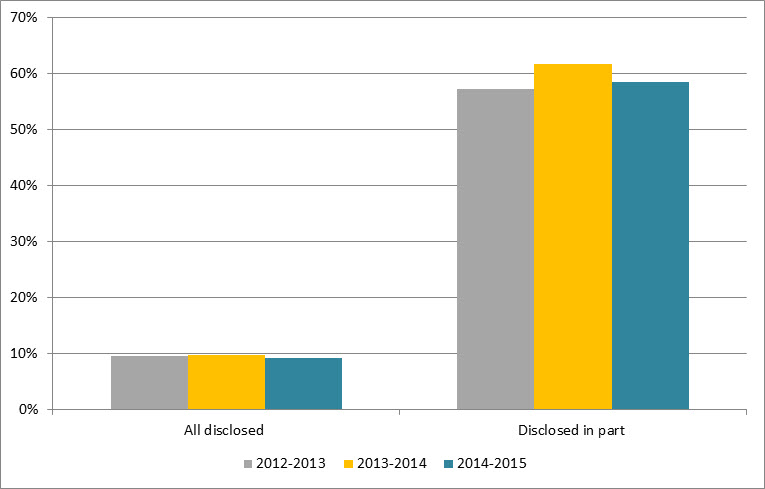
Text version
Figure 4 is a bar-chart with vertical bars, representing the entirely disclosed and disclosed in part requests as proportion of total requests completed by GAC during each reporting period between 2012-2013 and 2014-2015. The results are as follows:
| Disclosure | 2012-2013 | 2013-2014 | 2014-2015 |
|---|---|---|---|
| All disclosed | 9.49% | 9.76% | 9.15% |
| Disclosed in part | 57.31% | 61.71% | 58.43% |
Exemptions
There was very little change with the average number of exemptions used per completed request, increasing slightly from 2.80 in 2013-2014 to 2.92 in 2014-2015 (see Table 2).
The most common exemptions used by GAC in 2014-2015 were section 21 (Operations of Government) (28.7%), followed by section 15 (International Affairs and Defence) (19.5%) and section 19 (Personal Information) (16.9%).
Table 2: Exemptions
| Exemptions | 2012-2013 | 2013-2014 | 2014-2015 |
|---|---|---|---|
| Total number of exemptions | 2,341 | 3,615 | 2,877 |
| Total number of completed requests | 1,033 | 1,290 | 984 |
| Average number of exemptions per request | 2.27 | 2.80 | 2.92 |
Complaints at the OIC
The number of complaints received against GAC was 83Footnote 6 in 2014-2015, which is a decrease from 120 complaints received the previous period. For the most part, this reduction is due to a decrease in refusal complaints (99 refusal and 21 administrative complaints in 2013-2014 compared to 63 refusal and 20 administrative complaints in 2014-2015).
In 2014-2015, 16 complaints were well-founded, 1 was not well-founded, 20 were discontinued and 36 were pending resolution.
Footnotes
- Footnote 1
-
This report amalgamates the data for the Canadian International Development Agency, the Department of Foreign Affairs and International Trade, and the Department of Foreign Affairs, Trade and Development for 2013-2014.
- Footnote 2
-
Overall performance is based on two primary indicators: % of requests completed within 30 days, % of requests that were fully disclosed.
- Footnote 3
-
The title of Foreign Affairs, Trade and Development Canada was changed to Global Affairs Canada
- Footnote 4
-
The completion rate was calculated using the number of received requests during the reporting period as well as outstanding requests from the previous period.
- Footnote 5
-
The 2007-2008 OIC report card grading system was used to estimate the grade A= 0 to 5%; B= 5 to 10%; C=10 to 15%, D= 15 to 20%, F=20% and more.
- Footnote 6
-
The numbers reported in this section are based on the OIC’s statistics. The information may not reflect the statistics reported by institutions due to the discrepancies in the methodology used.