2014-2015 Fisheries and Oceans Canada
Overall performanceFootnote 1
Fisheries and Oceans Canada (DFO) experienced an increase of 22.8% in the number of requests received and improved the percentage of requests completed within 30 days by 1.8%. This report provides comparative statistics for the last three periods (2012-2015).
Workload
DFO received 512 requests under the Access to Information Act (the Act), representing 0.8% of total requests received government-wide in 2014-2015. In 2013-2014, DFO received 417 requests, which accounts for 22.8% fewer requests than those received this reporting period. The majority of requests in 2014-2015 were from the business sector (33.6%) and the public (32.0%) followed by the media (21.7%). Requests from business, public and media increased by 44.5%, 5.8% and 35.4% respectively.
DFO completed 503 requests this reporting period. The completion rateFootnote 2 was 72.1%, which is below the government-wide rate of 85.1% for 2014-2015 and 4.0% less than the completion rate in the previous period. DFO also received 118 informal requests and 67.8% of these were completed within 30 days. The number of consultations received by DFO from other federal government institutions increased from 170 to 226, representing a increase of 32.9% compared to 2013-2014.
The total number of pages processed increased from 183,315 pages in 2013-2014 to 307,313 pages in 2014-2015 representing an increase of 67.6%. Table 1 shows that the average number of pages processed per completed request increased from 538 in 2013-2014 to 770 in 2014-2015.
The information released by DFO was mostly in paper format: 224 requests in paper format compared to 120 requests in electronic format.
Table 1. Workload
| Measures | 2012-2013 | 2013-2014 | 2014-2015 |
|---|---|---|---|
| Number of requests received | 547 | 417 | 512 |
| Annual change (%) | - | -23.8% | 22.8% |
| Completed requests | 453 | 397 | 503 |
| Annual change (%) | - | -12.4% | 26.7% |
| Number of consultations received (from other government institutions) | 288 | 170 | 226 |
| Annual change (%) | - | -41.0% | 32.9% |
| Average number of pages processed per request completed | 378 | 538 | 770 |
| % of requests for which more than 1,000 pages were processed | 8.2% | 13.5% | 15.0% |
Request completion time
Timeliness
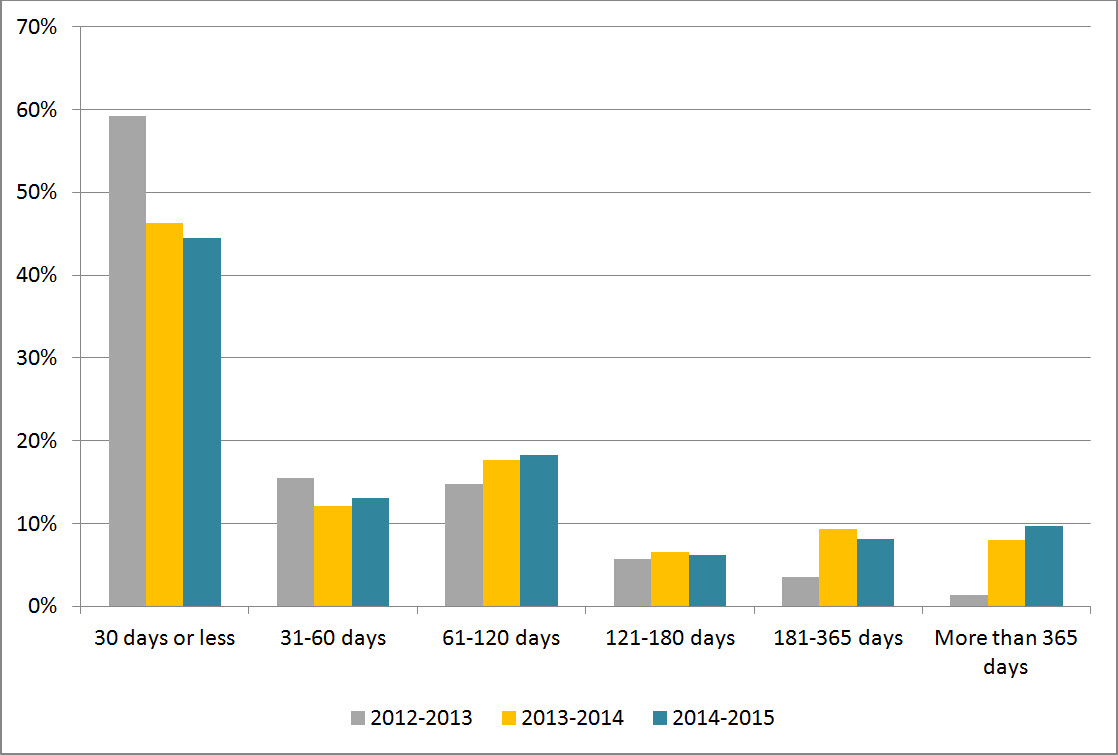
Figure 1 reveals that 44.5% of requests were completed within 30 days or less, which is slightly lower than the result observed in 2013-2014. There is also a slight increase of 1.6% in the completion of requests for more than 365 days.
Figure 1: Request Completion Time
Text version
Figure 1 is a bar chart with vertical bars, representing the completion time by DFO during each reporting period between 2012-2013 and 2014-2015. The results are as follows:
| Completion time | 2012-2013 | 2013-2014 | 2014-2015 |
|---|---|---|---|
| 30 days or less | 59.16% | 46.35% | 44.53% |
| 31-60 days | 15.45% | 12.09% | 13.12% |
| 61-120 days | 14.79% | 17.63% | 18.29% |
| 121-180 days | 5.74% | 6.55% | 6.16% |
| 181-365 days | 3.53% | 9.32% | 8.15% |
| More than 365 days | 1.32% | 8.06% | 9.74% |
Extensions
DFO took 365 extensions in 2014-2015 compared to 273 in 2013-2014. The most common reason for taking an extension was consultations (44.1%), followed by interference with operations (32.6%) and third-party notice (23.2%).
We note that extensions taken for consultations with other departments increased to 139 in 2014-2015 compared to 94 in 2013-2014. Extensions for third party notice doubled this reporting period from 2013-2014.
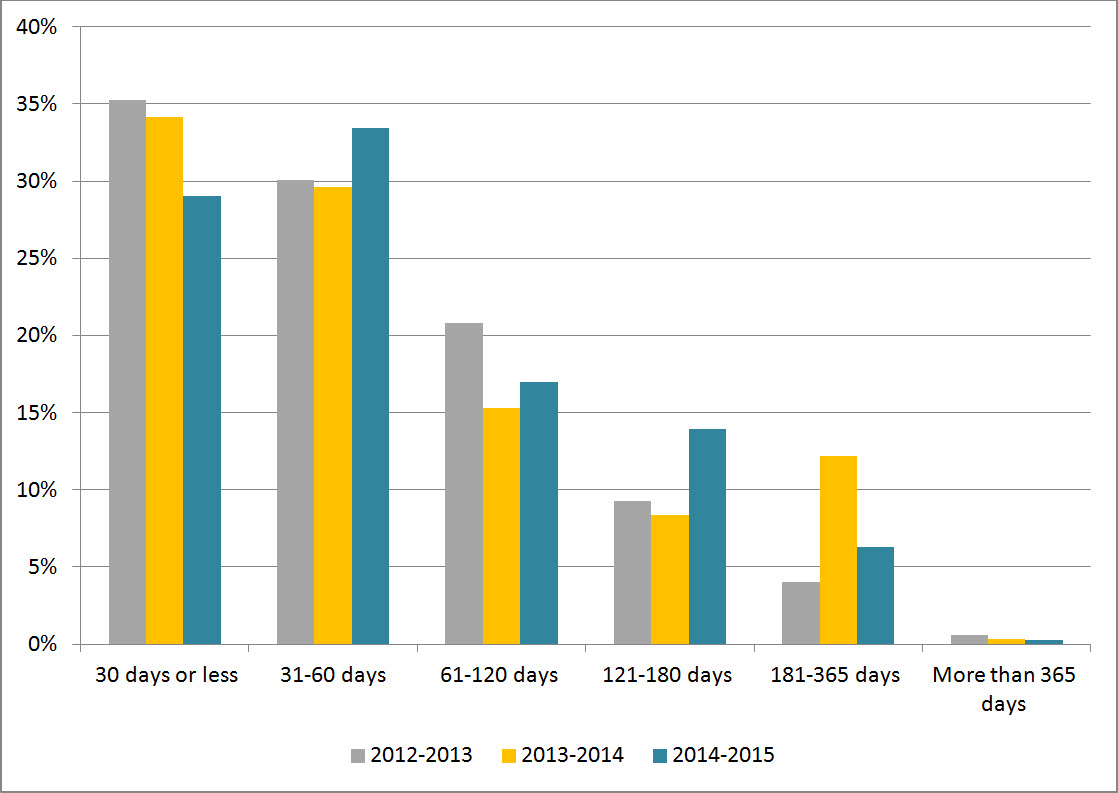
Figure 2 shows that 29.0% of extensions taken in 2014-2015 were for 30 days or less. This measure is lower by 4.4% compared to 2013-2014. Figure 2 also shows that the number of requests extended between 31 and 60 days in 2014-2015 increased by 3.8% compared to the previous period.
Figure 2: Length of Extensions
Text version
Figure 2 is a bar chart with vertical bars, representing the length of extensions taken by DFO during each reporting period between 2012-2013 and 2014-2015. The results are as follows:
| Length of extensions | 2012-2013 | 2013-2014 | 2014-2015 |
|---|---|---|---|
| 30 days or less | 35.26% | 34.15% | 29.04% |
| 31-60 days | 30.06% | 29.62% | 33.42% |
| 61-120 days | 20.81% | 15.33% | 16.99% |
| 121-180 days | 9.25% | 8.36% | 13.97% |
| 181-365 days | 4.05% | 12.20% | 6.30% |
| More than 365 days | 0.58% | 0.35% | 0.27% |
Deemed refusals
In 2014-2015, the number of requests closed past the statutory deadline was 91, which accounts for 18.1% of completed requests, which is similar to results of the last period. This rate represents a “D” grade.Footnote 3 The most common reason for overdue requests was workload (79.1%), followed by external consultations (20.9%).
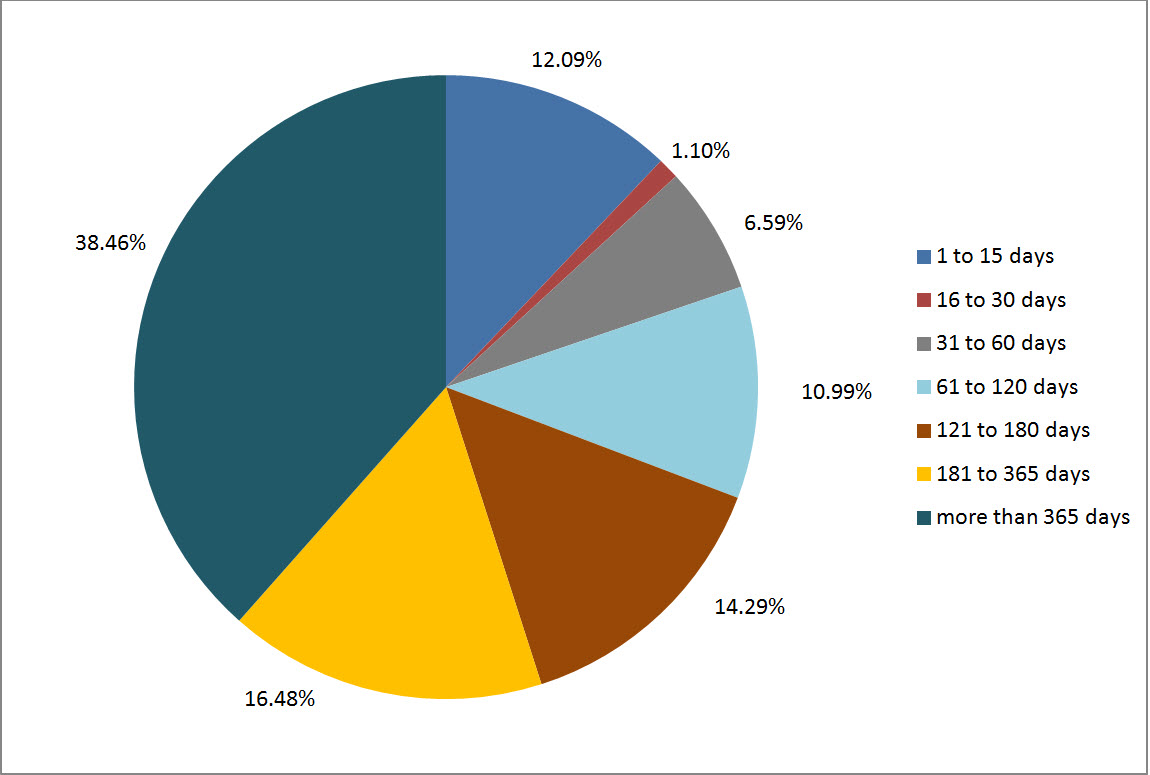
Figure 3 shows 13.2% were late by 30 days or less. The percentage of requests overdue for more than 365 days increased from 12% in 2013-2014 to 38.5% in this reporting period. DFO’s annual report on the administration of the Act attributes delay to the substantial increase in the volume of requests received (see workload section).
Figure 3: Lateness of Overdue Requests
Text version
Figure 3 is a pie chart, representing the delayed days for overdue requests taken by DFO in 2014-2015. The results are as follows:
| Number of days | 2014-2015 |
|---|---|
| 1 to 15 days | 12.09% |
| 16 to 30 days | 1.10% |
| 31 to 60 days | 6.59% |
| 61 to 120 days | 10.99% |
| 121 to 180 days | 14.29% |
| 181 to 365 days | 16.48% |
| More than 365 days | 38.46% |
| Total | 100.0% |
Disclosure
Percentage of requests for which information was disclosed
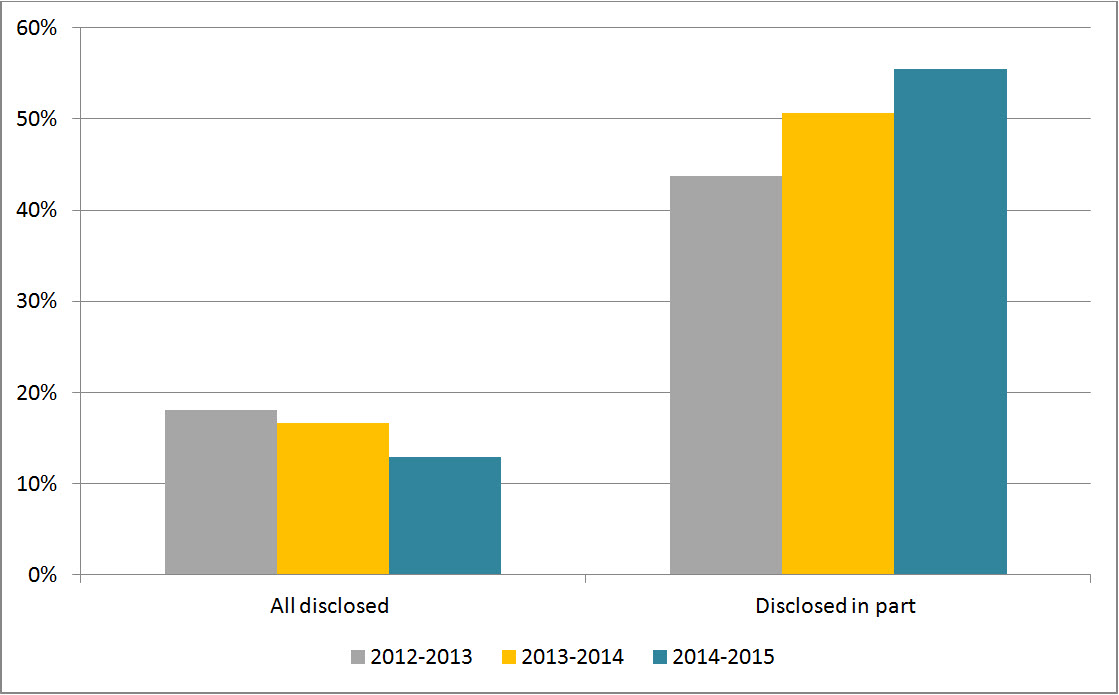
In 2014-2015, 12.9% of completed requests were entirely disclosed, which is the lowest disclosure rate since 2012 (see Figure 4). Figure 4 also shows that the rate for partially disclosed requests was 55.5% in 2014-2015, which is an increase of 4.9% from the previous period.
Figure 4: Level of Disclosure
Text version
Figure 4 is a bar-chart with vertical bars, representing the entirely disclosed and disclosed in part requests as proportion of total requests completed by DFO during each reporting period between 2012-2013 and 2014-2015. The results are as follows:
| Disclosure | 2012-2013 | 2013-2014 | 2014-2015 |
|---|---|---|---|
| All disclosed | 18.10% | 16.62% | 12.92% |
| Disclosed in part | 43.71% | 50.63% | 55.47% |
Exemptions
DFO applied 967 exemptions in 2014-2015 compared to 747 in the previous period. There is almost no change in the average number of exemptions used per completed request (1.92 in 2014-2015 and 1.88 in 2013-2014) (see Table 2). The most common exemptions in 2014-2015 were section 21 (Government Operations) (32.8%), followed by section 19 (Personal Information) (24.9%) and section 20 (Third-Party Information) (16.5%).
Table 2: Exemptions
| Exemptions | 2012-2013 | 2013-2014 | 2014-2015 |
|---|---|---|---|
| Total number of exemptions | 643 | 747 | 967 |
| Total number of completed requests | 453 | 397 | 503 |
| Average number of exemptions per completed request | 1.42 | 1.88 | 1.92 |
Complaints at the OIC
The number of complaints received by the OIC against DFO decreased from 21 in 2013-2014 to 18 in 2014-2015.Footnote 4 The number of administrative complaints increased compared to the previous period (13 administrative and 8 refusal complaints in 2013-2014 to 17 administrative and 1 refusal complaints in 2014-2015).
Of the ones received in 2014-2015, 13 were well founded and resolved. Discontinued and pending complaints accounted for 3 and 2 complaints, respectively.
Footnotes
- Footnote 1
-
Overall performance is based on two primary indicators: % of requests completed within 30 days, % of requests that were fully disclosed.
- Footnote 2
-
The completion rate was calculated using the number of received requests during the reporting period as well as outstanding requests from the previous period.
- Footnote 3
-
The 2007-2008 OIC report card grading system was used to estimate the grade A= 0 to 5%; B= 5 to 10%; C=10 to 15%, D= 15 to 20%, F=20% and more.
- Footnote 4
-
The numbers reported in this section are based on the OIC’s statistics. The information may not reflect the statistics reported by institutions due to the discrepancies in the methodology used.