2014-2015 Department of Justice Canada
Overall performanceFootnote 1
The Department of Justice Canada (JUS) experienced a decrease in the number of requests of 5.1% and increased the number of requests completed within 30 days by 2.4%. This report provides comparative statistics for the last three periods (2012-2015).
Workload
JUS received 520 requests under the Access to Information Act (the Act), representing 0.1% of total requests received across government in 2014-2015. The number of requests received this reporting period shows a decreased by 5.1% compared to the previous year.
The majority of requests received by JUS were from the public (40.0%), followed by the media (27.5%) and the business sector (16.5%). The number of requests from the public and the business sector increased by 10.1% and 16.2% respectively from the previous year, while requests from the media dropped by 41.6%.
JUS completed 551 requests this reporting period. The completion rateFootnote 2 was 87.0%, which is higher than the government-wide rate of 85.1%. In 2013-2014, the completion rate for JUS was 82.4%. JUS also received 148 informal requests in 2014-2015 and 139 of these were completed within 30 days. The number of consultations received by JUS from other federal government institutions decreased from 917 to 584, representing a decrease of 36.3% compared to 2013-2014. The number of consultations received by JUS was higher than the number of requests it received.
In 2014-2015, JUS processed 156,091 pages. The average number of pages processed per completed request was similar to the previous year.
The information released by JUS was mostly in paper format: 164 in paper format compared to 79 in electronic format.
Table 1: Workload
| Measures | 2012-2013 | 2013-2014 | 2014-2015 |
|---|---|---|---|
| Number of requests received | 343 | 548 | 520 |
| Annual change (%) | - | 59.8% | -5.1% |
| Completed requests | 323 | 528 | 551 |
| Annual change (%) | - | 63.5% | 4.4% |
| Number of consultations received (from other government institutions) | 1,339 | 917 | 584 |
| Annual change (%) | - | -31.5% | -36.3% |
| Average number of pages processed per request completed | 472 | 498 | 496 |
| % of requests for which more than 1,000 pages were processed | 8.6% | 7.9% | 8.6% |
Requests completion time
Timeliness
Figure 1 reveals that 74.4% of requests were completed in 30 days or less, which is slightly higher than the results observed in 2013-2014 and well above the government-wide average. The number of requests completed in more than 30 days was relatively similar.
Figure 1: Request Completion Time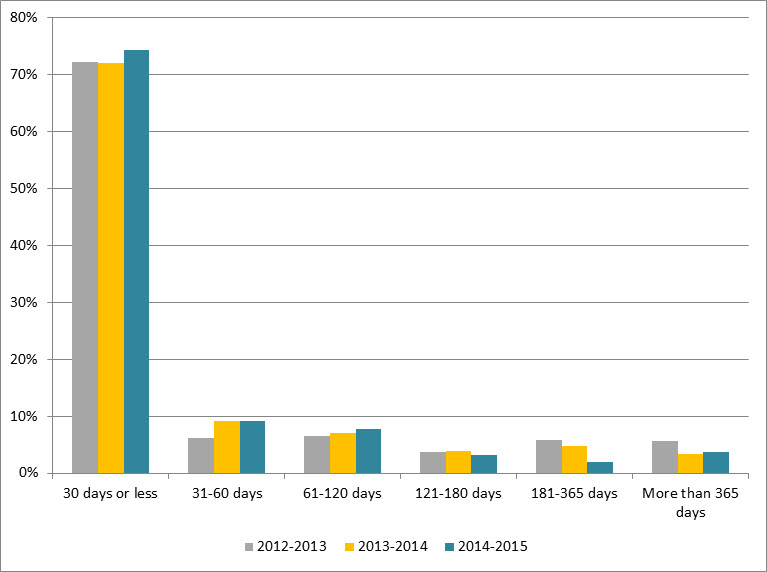
Text version
Figure 1 is a bar chart with vertical bars, representing the completion time by JUS during each reporting period between 2012-2013 and 2014-2015. The results are as follows:
| Completion time | 2012-2013 | 2013-2014 | 2014-2015 |
|---|---|---|---|
| 30 days or less | 72.14% | 71.97% | 74.41% |
| 31-60 days | 6.19% | 9.09% | 9.07% |
| 61-120 days | 6.50% | 7.01% | 7.80% |
| 121-180 days | 3.72% | 3.79% | 3.09% |
| 181-365 days | 5.88% | 4.73% | 2.00% |
| More than 365 days | 5.57% | 3.41% | 3.63% |
Extensions
JUS took a total of 172 extensions in 2014-2015 compared to 141 in 2013-2014. The most common reason for taking an extension was interference with operations (49.4%), followed by consultations (47.7%), and third-party notice (2.9%).
Figure 2 shows that 38.4% of extensions were taken for 30 days or less, which is higher by 4.8% compared to 2013-2014. Figure 2 also reveals that the proportion of extensions taken between 31 and 60 days in 2014-2015 increased by 3.1% compared to 2013-2014. We note that the extensions taken between 121 and 180 days decreased by 11.2%.
Figure 2: Length of Extensions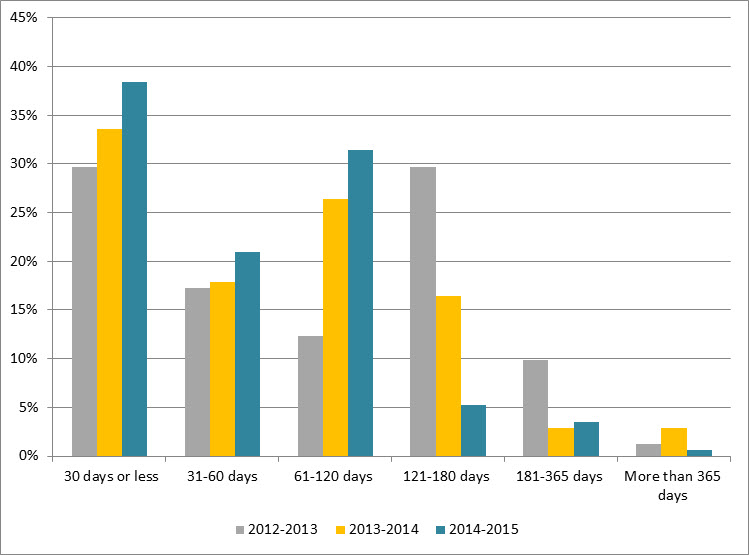
Text version
Figure 2 is a bar chart with vertical bars, representing the length of extensions taken by JUS during each reporting period between 2012-2013 and 2014-2015. The results are as follows:
| Length of extensions in % | 2012-2013 | 2013-2014 | 2014-2015 |
|---|---|---|---|
| 30 days or less | 29.63% | 33.57% | 38.37% |
| 31-60 days | 17.28% | 17.86% | 20.93% |
| 61-120 days | 12.35% | 26.43% | 31.40% |
| 121-180 days | 29.63% | 16.43% | 5.23% |
| 181-365 days | 9.88% | 2.86% | 3.49% |
| More than 365 days | 1.23% | 2.86% | 0.58% |
Deemed refusals
In 2014-2015, the number of requests closed past the statutory deadline was 42, which accounts for 7.6% of all completed request. This rate represents a “B” grade.Footnote 3 28.6% of these requests were late for 30 days or less while 40.5% were late by more than 365 days (see Figure 3). The most common reasons for not meeting statutory deadlines were workload (59.5%) and consultations (23.8%).
Figure 3: Lateness of Overdue Requests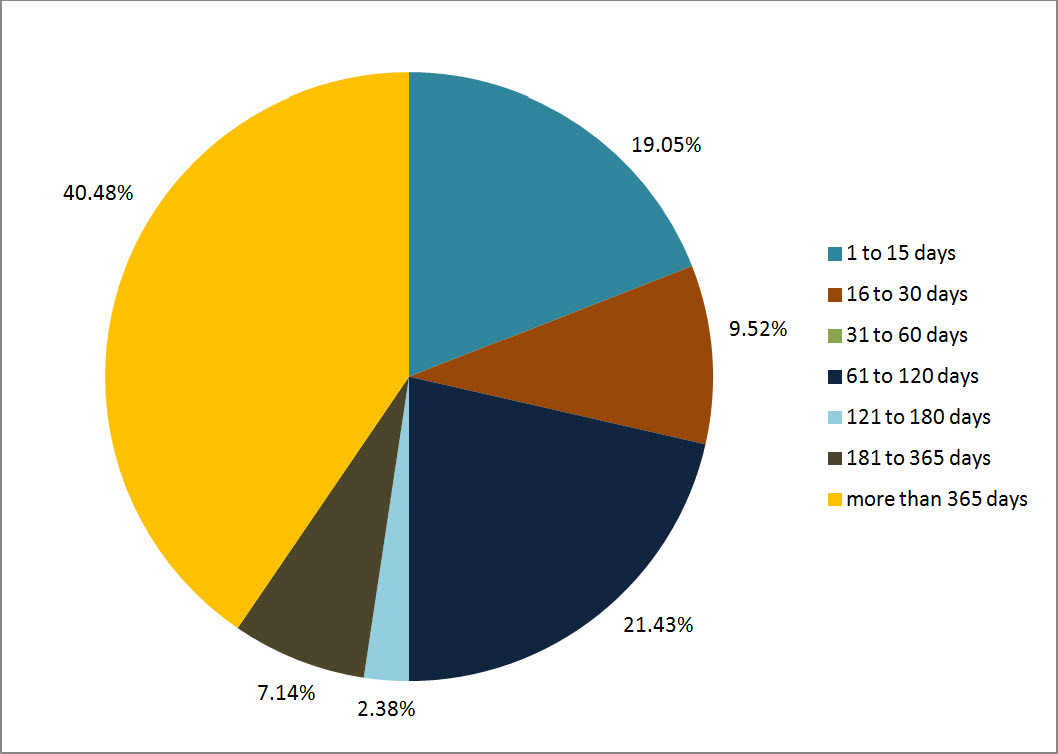
Text version
Figure 3 is a pie chart, representing the delayed days for overdue requests taken by JUS in 2014-2015. The results are as follows:
| Number of days | 2014-2015 |
|---|---|
| 1 to 15 days | 19.05% |
| 16 to 30 days | 9.52% |
| 31 to 60 days | 0.00% |
| 61 to 120 days | 21.43% |
| 121 to 180 days | 2.38% |
| 181 to 365 days | 7.14% |
| more than 365 days | 40.48% |
| Total | 100.0% |
Disclosure
Percentage of requests for which information was disclosed
In 2014-2015, 8.7% of completed requests were all disclosed, which is lower compared to 2013-2014 (see Figure 4). Figure 4 also shows that the rate for partially disclosed requests was 35.4% in 2014-2015, which is a decrease of 8.6% from the previous period.
Figure 4: Level of Disclosure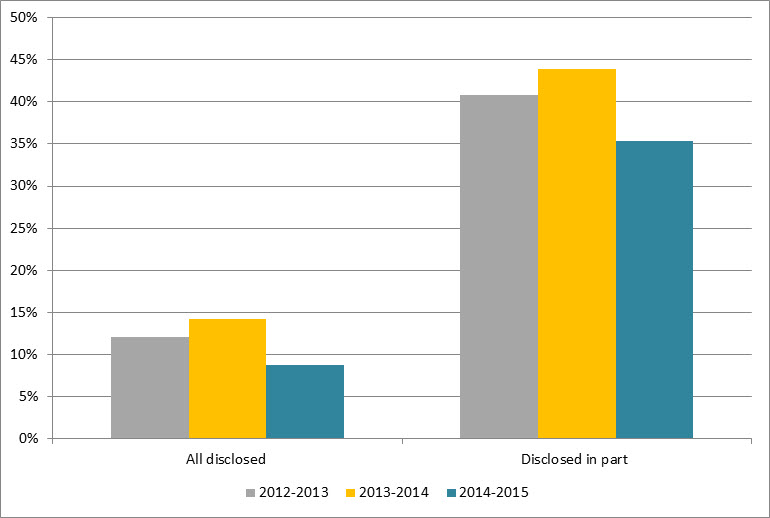
Text version
Figure 4 is a bar-chart with vertical bars, representing the entirely disclosed and disclosed in part requests as proportion of total requests completed by JUS during each reporting period between 2012-2013 and 2014-2015. The results are as follows:
| Disclosure | 2012-2013 | 2013-2014 | 2014-2015 |
|---|---|---|---|
| All disclosed | 12.07% | 14.20% | 8.71% |
| Disclosed in part | 40.87% | 43.94% | 35.39% |
Exemptions
The number of exemptions used per completed requests decreased slightly from 1.24 in 2013-2014 to 1.13 in 2014-2015 (see Table 2). The most used exemptions for this reporting period were section 21 (Operations of Government) (30.0%), section 19 (Personal Information) (22.4%) and section 23 (solicitor-client privilege) (18.1%) in 2014-2015.
Table 2: Exemptions
| Exemptions | 2012-2013 | 2013-2014 | 2014-2015 |
|---|---|---|---|
| Total number of exemptions | 395 | 655 | 624 |
| Total number of completed requests | 323 | 528 | 551 |
| Average number of exemptions per request | 1.22 | 1.24 | 1.13 |
Complaints at the OIC
The number of complaints receivedFootnote 4 against JUS decreased from 51 in 2013-2014 to 44 this reporting period. We observed a large increase in the proportion of administrative complaints compared to the previous period (11.7% in 2013-2014 and 56.8% in 2014-2015). 17 complaints were well-founded, 9 discontinued, 4 settled and 14 were pending resolution.
Footnotes
- Footnote 1
-
Overall performance is based on two primary indicators: % of requests completed within 30 days, % of requests that were fully disclosed.
- Footnote 2
-
The completion rate was calculated using the number of received requests during the reporting period as well as outstanding requests from the previous period.
- Footnote 3
-
The 2007-2008 OIC report card grading system was used to estimate the grade A= 0 to 5%; B= 5 to 10%; C=10 to 15%, D= 15 to 20%, F=20% and more.
- Footnote 4
-
The numbers reported in this section are based on the OIC’s statistics. The information may not reflect the statistics reported by institutions due to the discrepancies in the methodology used.