2014-2015 Department of Finance Canada
Overall performanceFootnote 1
The Department of Finance Canada’s (FIN) saw a decrease of 5.1% in the number of requests received. Its overall performance in 2014-2015 was similar compared to the previous period. This report provides comparative statistics for the last three periods (2012-2015).
Workload
FIN received 519 requests under the Access to Information Act (the Act), representing 0.7% of total requests received across government in 2014-2015. The majority of requests received by FIN were from the media (36.4%), followed by the business sector (23.9%). Requests from the media decreased by 42.6% this reporting period compared to 2013-2014, whereas requests from the business sector increased by 27.8%.
FIN completed 482 requests this reporting period. The completion rateFootnote 2 was 80.1%, which is lower than the government-wide rate of 85.1% and a decrease of 7.5% compared to FIN’s completion rate in the previous period. FIN also received 292 informal requests in 2014-2015, and 80.8% were completed within 30 days. The number of consultations received by FIN from other federal government institutions decreased from 189 to 159, representing a decrease of 15.9% compared to 2013-2014.
In 2014-2015, FIN processed 48,699 pages. The average number of pages processed per completed request increased from 130 in 2013-2014 to 136 in 2014-2015.
The information released by FIN was mostly in paper format: 222 requests in paper format compared to 118 in electronic format
Table 1. Workload
| Measures | 2012-2013 | 2013-2014 | 2014-2015 |
|---|---|---|---|
| Number of requests received | 495 | 547 | 519 |
| Annual change (%) | - | 10.5% | -5.1% |
| Completed requests | 458 | 573 | 482 |
| Annual change (%) | - | 25.1% | -15.9% |
| Number of consultations received (from other government institutions) | 261 | 189 | 159 |
| Annual change (%) | - | -27.6% | -15.9% |
| Average number of pages processed per request completed | 135 | 130 | 136 |
| % of requests for which more than 1000 pages were processed | 2.2% | 2.7% | 1.7% |
Request completion time
Timeliness
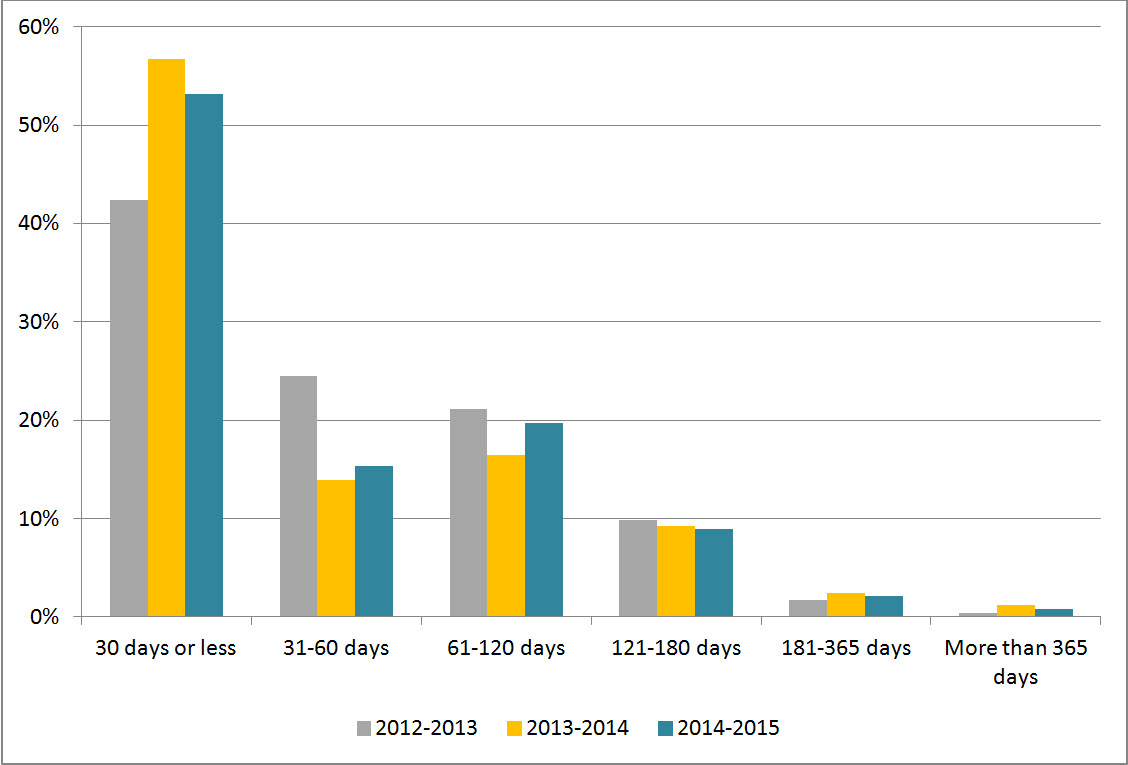
Figure 1 shows that 53.1% of requests were completed in 30 days or less, which is slightly lower than the results observed in 2013-2014 (56.7%). The proportion of requests completed between 31 and 60 days increased slightly by 1.4%. We also saw a marginal reduction in the percentage of requests completed in more than 365 days.
Figure 1: Request Completion Time
Text version
Figure 1 is a bar chart with vertical bars, representing the completion time by FIN during each reporting period between 2012-2013 and 2014-2015. The results are as follows:
| Completion time | 2012-2013 | 2013-2014 | 2014-2015 |
|---|---|---|---|
| 30 days or less | 42.36% | 56.72% | 53.11% |
| 31-60 days | 24.45% | 13.96% | 15.35% |
| 61-120 days | 21.18% | 16.40% | 19.71% |
| 121-180 days | 9.83% | 9.25% | 8.92% |
| 181-365 days | 1.75% | 2.44% | 2.07% |
| More than 365 days | 0.44% | 1.22% | 0.83% |
Extensions
FIN took a total of 255 extensions in 2014-2015 compared to 299 in 2013-2014. Most extensions were for consultations (61.2%), followed by interference with operations (20.0%), and third-party notice (18.8%).
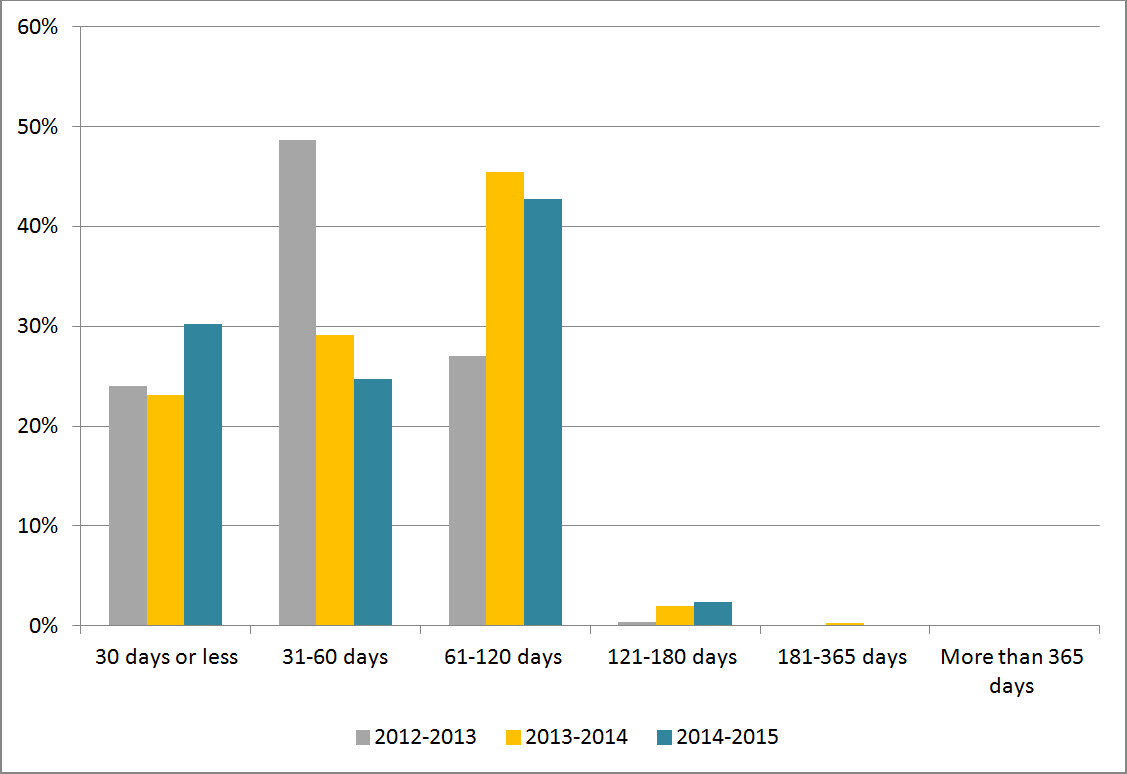
Figure 2 shows that 30.2% of extensions were taken for 30 days or less, which is an increase of 7.1% from the previous period. Figure 2 also shows that the proportion of extensions taken between 31 and 60 days in 2014-2015 decreased significantly by 23.9% since 2012-2013. No extensions were taken for more than 180 days in 2014-2015.
Figure 2: Length of Extensions
Text version
Figure 2 is a bar chart with vertical bars, representing the length of extensions taken by FIN during each reporting period between 2012-2013 and 2014-2015. The results are as follows:
| Length of extensions | 2012-2013 | 2013-2014 | 2014-2015 |
|---|---|---|---|
| 30 days or less | 23.99% | 23.08% | 30.20% |
| 31-60 days | 48.65% | 29.10% | 24.71% |
| 61-120 days | 27.03% | 45.48% | 42.75% |
| 121-180 days | 0.34% | 2.01% | 2.35% |
| 181-365 days | 0.00% | 0.33% | 0.00% |
| More than 365 days | 0.00% | 0.00% | 0.00% |
Deemed refusals
In 2014-2015, the number of requests closed past the statutory deadline was 37, which accounts for 7.7% of completed request. This rate represents a “B” grade.Footnotee 3 The most common reasons for overdue requests were external consultations (24.3%), internal consultations (18.9%), others (43.2%) and workload (13.5%).
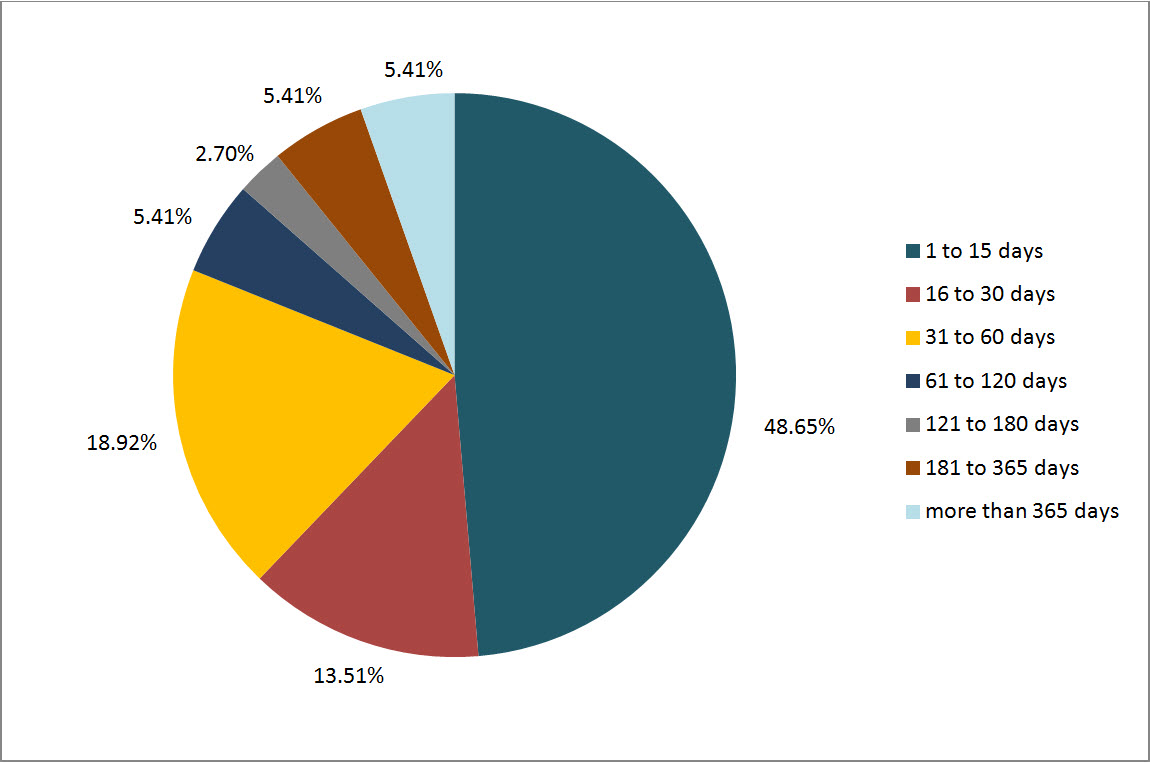
Figure 3 shows that 48.7% of the overdue requests were late by 15 days or less and 13.5% of were late between 16 and 30 days. In total, 62.2% of overdue requests were late by 30 days or less.
Figure 3: Lateness of Overdue Requests
Text version
Figure 3 is a pie chart, representing the delayed days for overdue requests taken by FIN in 2014-2015.The results are as follows:
| Number of days | 2014-2015 |
|---|---|
| 1 to 15 days | 48.65% |
| 16 to 30 days | 13.51% |
| 31 to 60 days | 18.92% |
| 61 to 120 days | 5.41% |
| 121 to 180 days | 2.70% |
| 181 to 365 days | 5.41% |
| More than 365 days | 5.41% |
| Total | 100.0% |
Disclosure
Percentage of requests for which information was disclosed
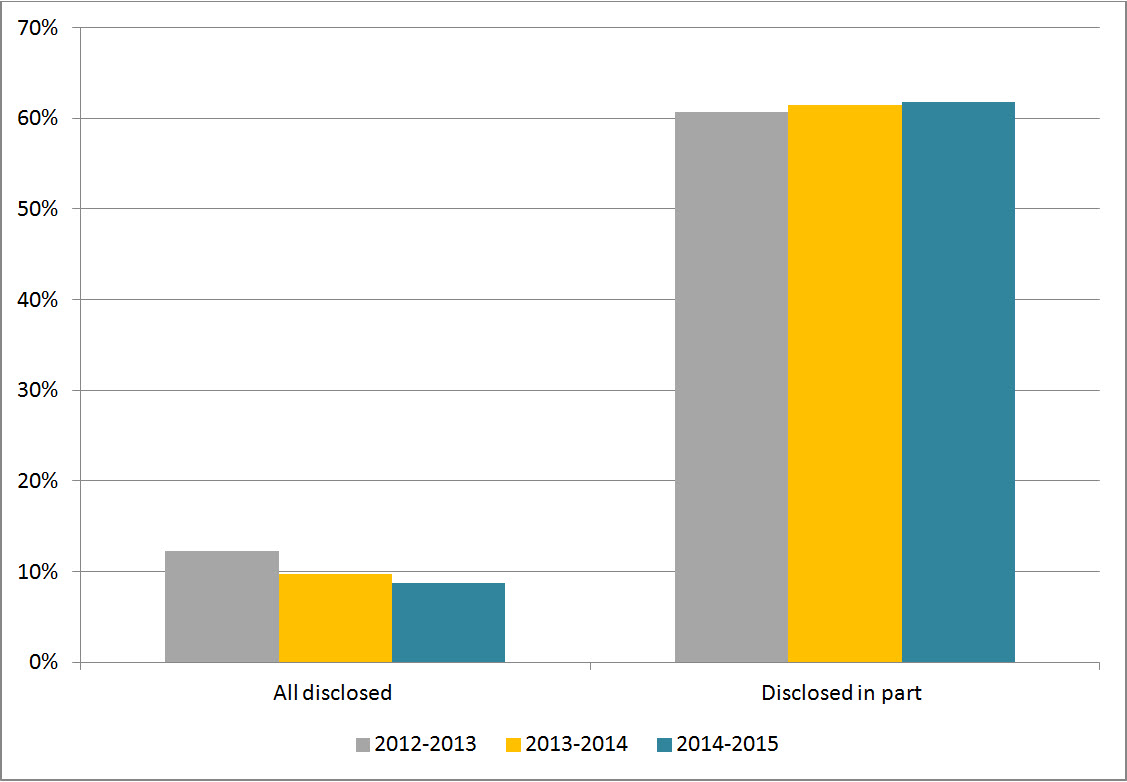
In 2014-2015, 42 of completed requests were entirely disclosed, representing 8.7% of all completed requests. This is the lowest disclosure rate since 2012 (see Figure 4). Figure 4 also shows that the rate for partially disclosed requests was 61.8% in 2014-2015, which is similar to the previous two periods.
Figure 4: Level of Disclosure
Text version
Figure 4 is a bar-chart with vertical bars, representing the entirely disclosed and disclosed in part requests as proportion of total requests completed by FIN during each reporting period between 2012-2013 and 2014-2015.The results are as follows:
| Disclosure | 2012-2013 | 2013-2014 | 2014-2015 |
|---|---|---|---|
| All disclosed | 12.23% | 9.77% | 8.71% |
| Disclosed in part | 60.70% | 61.43% | 61.83% |
Exemptions
The average number of exemptions used per completed request decreased from 3.22 in 2013-2014 to 2.97 in 2014-2015 (see Table 2).
The most used exemptions in 2014-2015 were for section 21 (Operations of Government) (39.9%), section 20 (Third-Party Information) (10.6%) and section 14 (Federal-Provincial Affairs) (10.8%). In general, we observed an increase in the use of exemptions compared to previous period.
Table 2: Exemptions
| Exemptions | 2012-2013 | 2013-2014 | 2014-2015 |
|---|---|---|---|
| Total number of exemptions | 1,289 | 1,846 | 1,430 |
| Total number of completed requests | 458 | 573 | 482 |
| Average number of exemptions per completed request | 2.81 | 3.22 | 2.97 |
Complaints at the OIC
In 2014-2015, the OIC received 12 complaintsFootnote 4 against FIN, which is less compared to 19 complaints received in 2013-2014. The majority of complaints were refusal (10), while the minority were administrative (2). This is similar to last year’s complaints statistics (14 refusal and 5 administrative complaints).
Half of the complaints received in 2014-2015 were well-founded and resolved and half were discontinued this reporting period.