2014-2015 Correctional Service Canada
Overall performanceFootnote 1
Correctional Service Canada (CSC) saw a decrease of 11.9% in the number of requests received and a 7.3% decrease in the percentage of requests completed within 30 days. This report provides comparative statistics for the last three periods (2012-2015).
Workload
CSC received 555 requests under the Access to Information Act (the Act), representing 0.8% of total requests received government-wide in 2014-2015. In 2013-2014, CSC received 630 requests, which is 11.9% more requests than this year. The majority of requests received by CSC were from the public (67.2%), followed by the media (24.7%). Requests from the public decreased by 19.4% compared to 2013-2014, while requests from the media increased by 15.1%.
CSC completed 517 requests this reporting period. The completion rateFootnote 2 was 70.1%, which is lower than the government-wide rate of 85.1%. In 2013-2014, the completion rate for CSC was 77.3%. CSC also received 117 informal requests in 2014-2015 and 47.9% of these were completed within 30 days. The number of consultations received by CSC from other federal government institutions decreased from 119 to 88, representing a decrease of 26.1% compared to 2013-2014.
In 2014-2015, CSC processed 71,805 pages compared to 51,632 in 2013-2014. The average number of pages processed per completed request increased from 104 in 2013-2014 to 153 in 2014-2015.
The information released by CSC was mostly in paper format: 288 in paper format compared to 11 requests in electronic format.
Table 1. Workload
| Measures | 2012-2013 | 2013-2014 | 2014-2015 |
|---|---|---|---|
| Number of requests received | 785 | 630 | 555 |
| Annual change (%) | - | -19.7% | -11.9% |
| Completed requests | 712 | 618 | 517 |
| Annual change (%) | - | -13.2% | -16.3% |
| Number of consultations received (from other government institutions) | 135 | 119 | 88 |
| Annual change (%) | - | -11.9% | -26.1% |
| Average number of pages processed per request completed | 79 | 104 | 153 |
| % of requests for which more than 1,000 pages were processed | 1.2% | 1.4% | 2.4% |
Request completion time
Timeliness
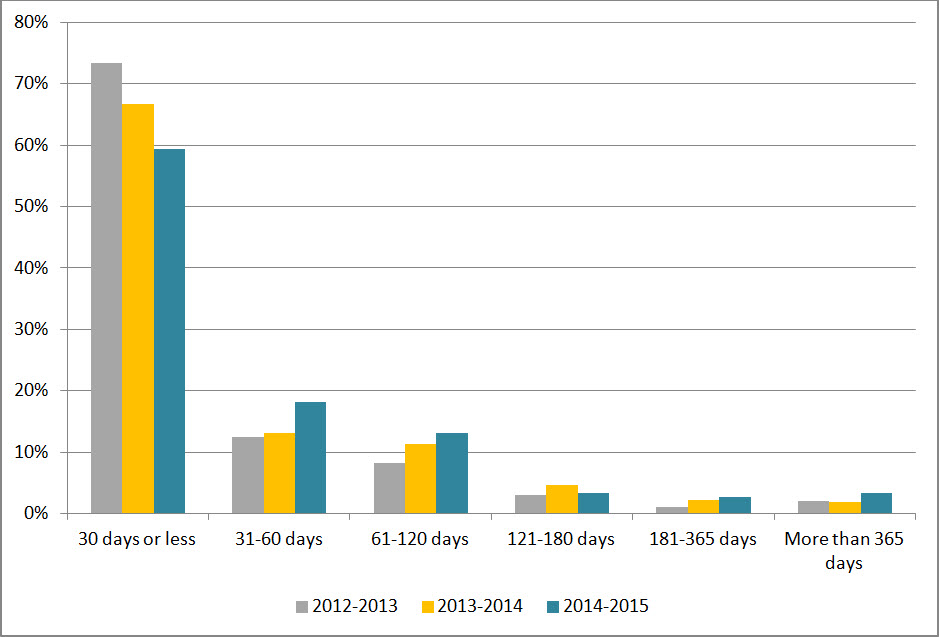
Figure 1 reveals that 59.4% of requests were completed within 30 days or less, which is 7.3% lower than the result observed in 2013-2014. The number of requests completed between 31 and 60 days increased by 16% compared to the previous reporting period.
Figure 1: Request Completion Time
Text version
Figure 1 is a bar chart with vertical bars, representing the completion time by CSC during each reporting period between 2012-2013 and 2014-2015. The results are as follows:
| Completion time | 2012-2013 | 2013-2014 | 2014-2015 |
|---|---|---|---|
| 30 days or less | 73.31% | 66.67% | 59.38% |
| 31-60 days | 12.50% | 13.11% | 18.18% |
| 61-120 days | 8.15% | 11.33% | 13.15% |
| 121-180 days | 2.95% | 4.69% | 3.29% |
| 181-365 days | 1.12% | 2.27% | 2.71% |
| More than 365 days | 1.97% | 1.94% | 3.29% |
Extensions
CSC took a total of 172 extensions in 2014-2015 compared to 194 in 2013-2014. The most common reason for taking an extension was interference with operations (76.7%), followed by consultations (18.6%), and third-party notice (4.7%).
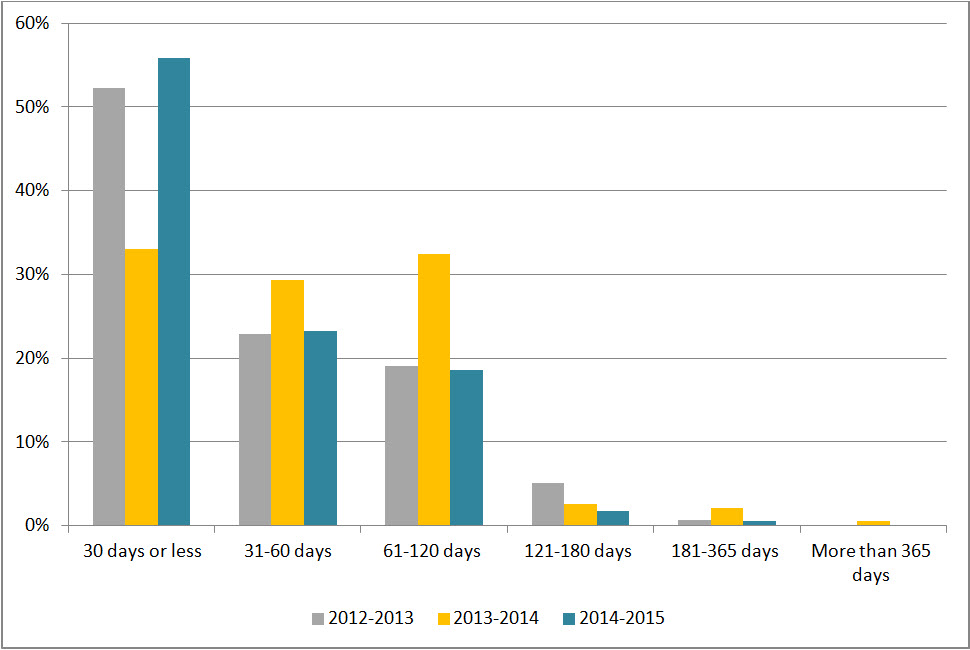
Figure 2 shows that 55.8% of the extensions taken in 2014-2015 were for 30 days or less, which is a 22.8% increase compared to the previous year. Figure 2 also shows that the number of extensions taken for more than 30 days in 2014-2015 was reduced compared to 2013-2014.
Figure 2: Length of Extensions
Text version
Figure 2 is a bar chart with vertical bars, representing the length of extensions taken by CSC during each reporting period between 2012-2013 and 2014-2015. The results are as follows:
| Length of extensions | 2012-2013 | 2013-2014 | 2014-2015 |
|---|---|---|---|
| 30 days or less | 52.23% | 32.99% | 55.81% |
| 31-60 days | 22.93% | 29.38% | 23.26% |
| 61-120 days | 19.11% | 32.47% | 18.60% |
| 121-180 days | 5.10% | 2.58% | 1.74% |
| 181-365 days | 0.64% | 2.06% | 0.58% |
| More than 365 days | 0.00% | 0.52% | 0.00% |
Deemed refusals
In 2014-2015, the number of requests closed past the statutory deadline was 117, which accounts for 22.6% of all completed requests. This rate represents an “F” grade.Footnote 3 This is a significant difference compared to the previous year where CSC received a “B.” The main reason for not meeting the statutory deadline in 2014-2015 was workload (91.4%).
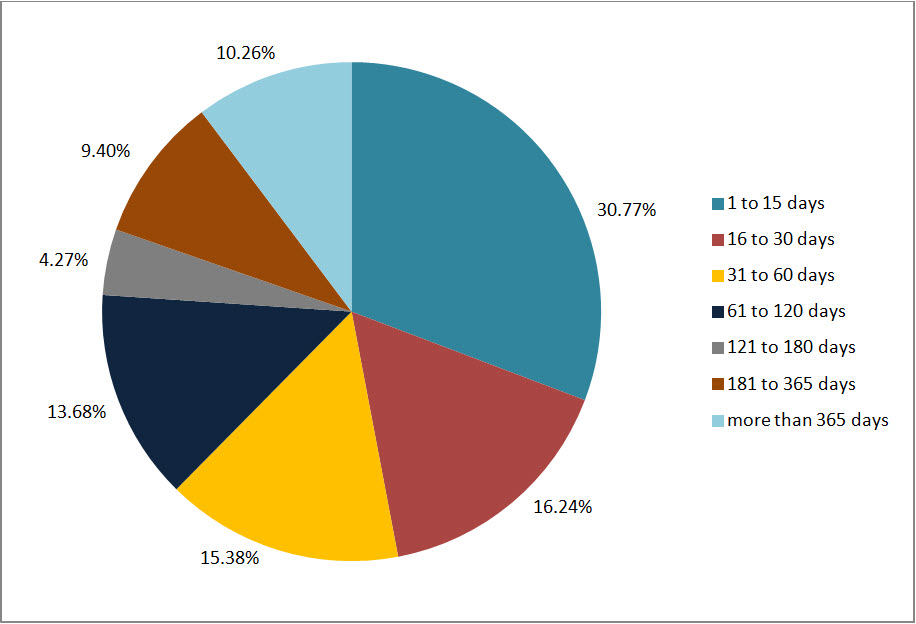
Figure 3 shows that 47.0% of the overdue requests were late by 30 days or less, 15.4% of requests were late between 31 and 60 days, and all remaining requests were late by more than 60 days.
Figure 3: Lateness of Overdue Requests
Text version
Figure 3 is a pie chart, representing the delayed days for overdue requests taken by CSC in 2014-2015. The results are as follows:
| Number of days | 2014-2015 |
|---|---|
| 1 to 15 days | 30.77% |
| 16 to 30 days | 16.24% |
| 31 to 60 days | 15.38% |
| 61 to 120 days | 13.68% |
| 121 to 180 days | 4.27% |
| 181 to 365 days | 9.40% |
| More than 365 days | 10.26% |
| Total | 100.0% |
Disclosure
Percentage of requests for which information was disclosed
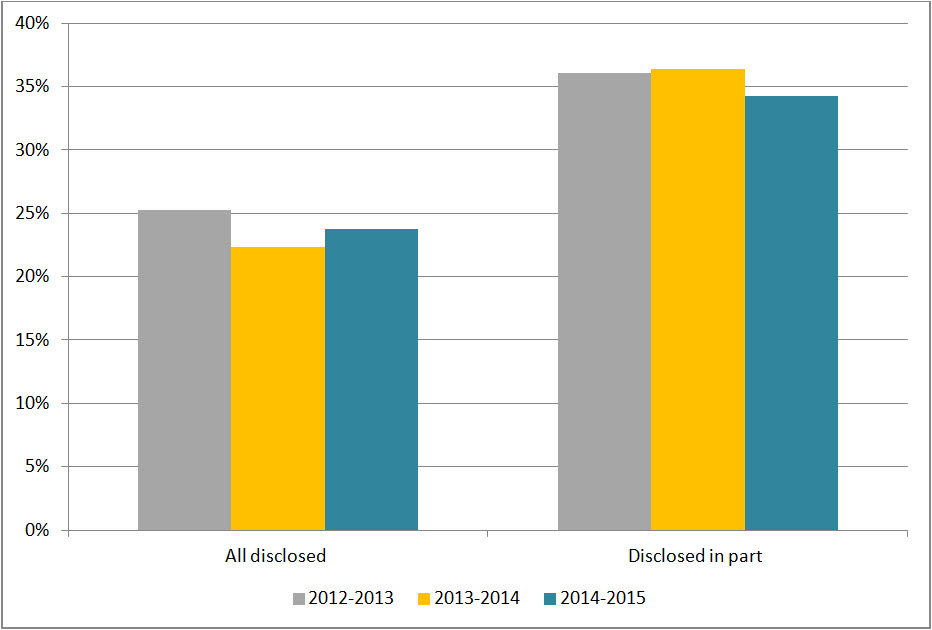
In 2014-2015, 23.8% of completed requests were entirely disclosed. This rate of disclosure is a slight improvement from the previous reporting period (see Figure 4). Figure 4 also shows that the rate for partially disclosed requests was 34.2% in 2014-2015, which is a small decrease of 2.2% from the previous period.
Figure 4: Level of Disclosure
Text version
Figure 4 is a bar-chart with vertical bars, representing the entirely disclosed and disclosed in part requests as proportion of total requests completed by CSC during each reporting period between 2012–2013 and 2014-2015. The results are as follows:
| Disclosure | 2012-2013 | 2013-2014 | 2014-2015 |
|---|---|---|---|
| All disclosed | 25.28% | 22.33% | 23.79% |
| Disclosed in part | 36.10% | 36.14% | 34.24% |
Exemptions
The average number of exemptions used per completed request decreased for 1.14 in 2013-2014 to 0.82 in 2014-2015 (see Table 2). The most frequently used exemptions in 2014-2015 were section 19 (Personal Information) (25.1%), section 16 (Law Enforcement and Investigations) (19.7%) and section 21 (Operations of Government) (19.5%). In general, we have observed a reduction of exemptions in the above mentioned provisions since 2012.
Table 2: Exemptions
| Exemptions | 2012-2013 | 2013-2014 | 2014-2015 |
|---|---|---|---|
| Total number of exemptions | 815 | 704 | 426 |
| Total number of completed requests | 712 | 618 | 517 |
| Average number of exemptions per completed request | 1.14 | 1.14 | 0.82 |
Complaints at the OIC
In 2014-2015, the OIC received 33 complaintsFootnote 4 against CSC, which is a reduction from the 56 received in 2013-2014. Similar to the previous period, most of the complaints were refusals. However, the proportion of refusals decreased from 57.1% in 2013-2014 to 45.5% in 2014-2015. In this reporting period, 12 complaints were well-founded, 3 were not well-founded, 11 were discontinued, 2 were settled and 5 were pending resolution.