2014-2015 Canada Border Services Agency
Overall performanceFootnote 1
The Canada Border Services Agency (CBSA) showed a similar performance as the previous year, despite a substantial increase of 43.5% in the number of requests received. This report provides comparative statistics for the last three periods (2012-2015).
Workload
In 2013-2014, CBSA received 4,671 requests compared to 6,705Footnote 2 in 2014-2015, which represents an increase of 43.5%. The 6,705 requests received by the department represented 9.8% of total requests received across government in 2014-2015. The majority of requests (74.6%) received by CBSA were from the public, followed by the business sector (20.5%).
CBSA completed 6,802 requests during this reporting period. The completion rateFootnote 3 was 86.2%, which is slightly higher that the government-wide rate, which was 85.1%. In 2013-2014, the completion rate for CBSA was 77.6%. They also received 450 informal requests in 2014-2015 and 89.8% of these were completed within 30 days. The number of consultations received by CBSA from other federal government institutions increased from 282 to 291, representing an increase of 3.2% compared to 2013-2014.
In 2014-2015, 442,779 pages were processed in comparison to 386,072 pages in 2013-2014. This represents a 14.7% increase in the number of pages processed. Table 1 shows that the average number of pages processed per request has decreased over the past three years from 112 pages in 2012-2013 to 69 pages in 2014-2015.
The information released by CBSA was mostly in paper format: 4,924 requests in paper format compared to 1,041 requests in electronic format. The number of requests released in paper format was 2,941 in 2013-2014.Footnote 4
Table 1. Workload
| Measures | 2012-2013 | 2013-2014 | 2014-2015 |
|---|---|---|---|
| Number of requests received | 3,147 | 4,671 | 6,705 |
| Annual change (%) | - | 48.4% | 43.5% |
| Completed requests | 2,891 | 4,079 | 6,802 |
| Annual change (%) | - | 41.1% | 66.8% |
| Number of consultations received (from other government institutions) | 366 | 282 | 291 |
| Annual change (%) | - | -23.0% | 3.2% |
| Average number of pages processed per request completed | 112 | 101 | 69 |
| % of requests for which more than 1,000 pages were processed | 2.3% | 1.9% | 1.1% |
Request completion time
Timeliness
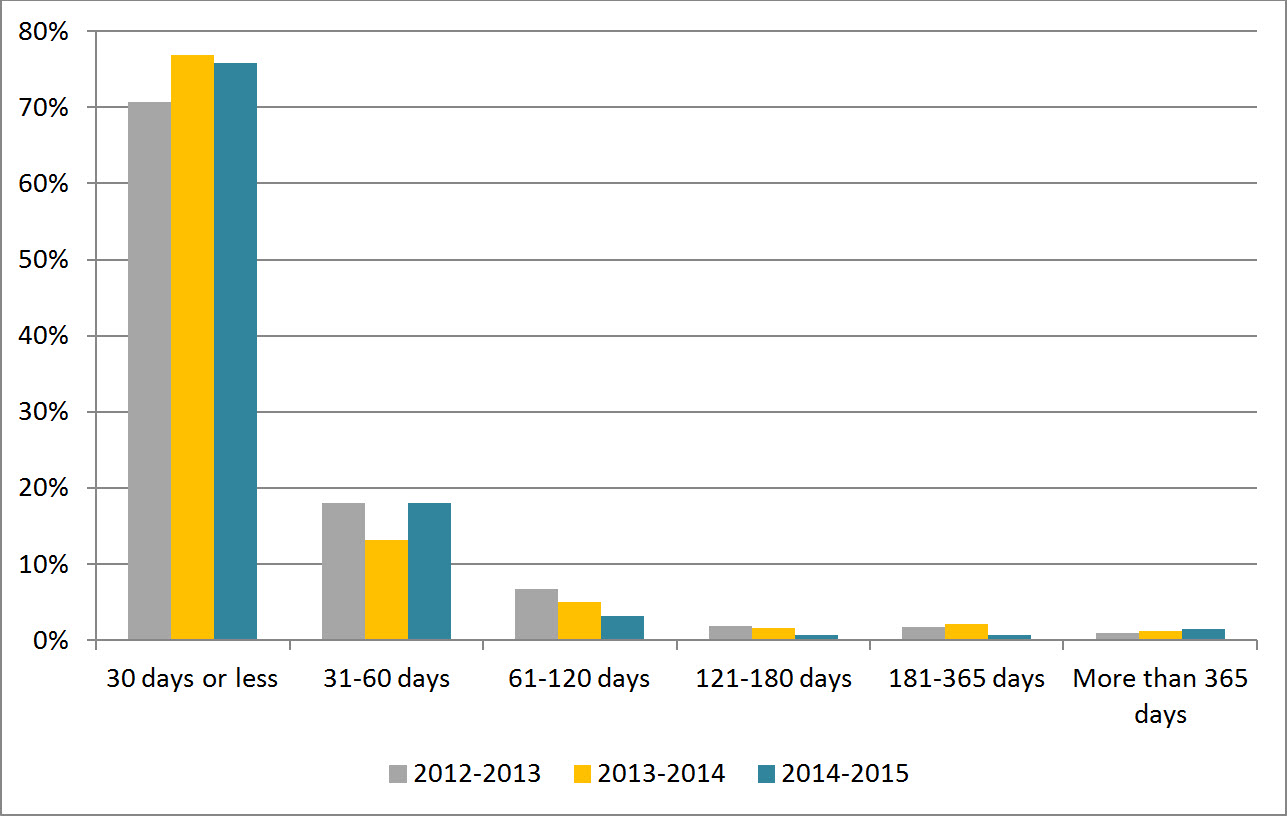
Figure 1 reveals that 75.9% of requests were completed in 30 days or less, which is similar to the result observed in 2013-2014 (76.9%).
Figure 1: Request Completion Time
Text version
Figure 1 is a bar chart with vertical bars, representing the completion time by CBSA during each reporting period between 2012-2013 and 2014-2015. The results are as follows:
| Completion time | 2012-2013 | 2013-2014 | 2014-2015 |
|---|---|---|---|
| 30 days or less | 70.67% | 76.86% | 75.86% |
| 31-60 days | 18.06% | 13.12% | 18.05% |
| 61-120 days | 6.71% | 5.03% | 3.16% |
| 121-180 days | 1.90% | 1.59% | 0.75% |
| 181-365 days | 1.73% | 2.16% | 0.75% |
| More than 365 days | 0.93% | 1.25% | 1.43% |
Extensions
CBSA took a total of 445 extensions in 2014-2015 compared to 467 in 2013-2014. The most common reason for taking an extension was consultations (53.3%), followed by interference with operations (44.7%), and third-party notice (2.0%).
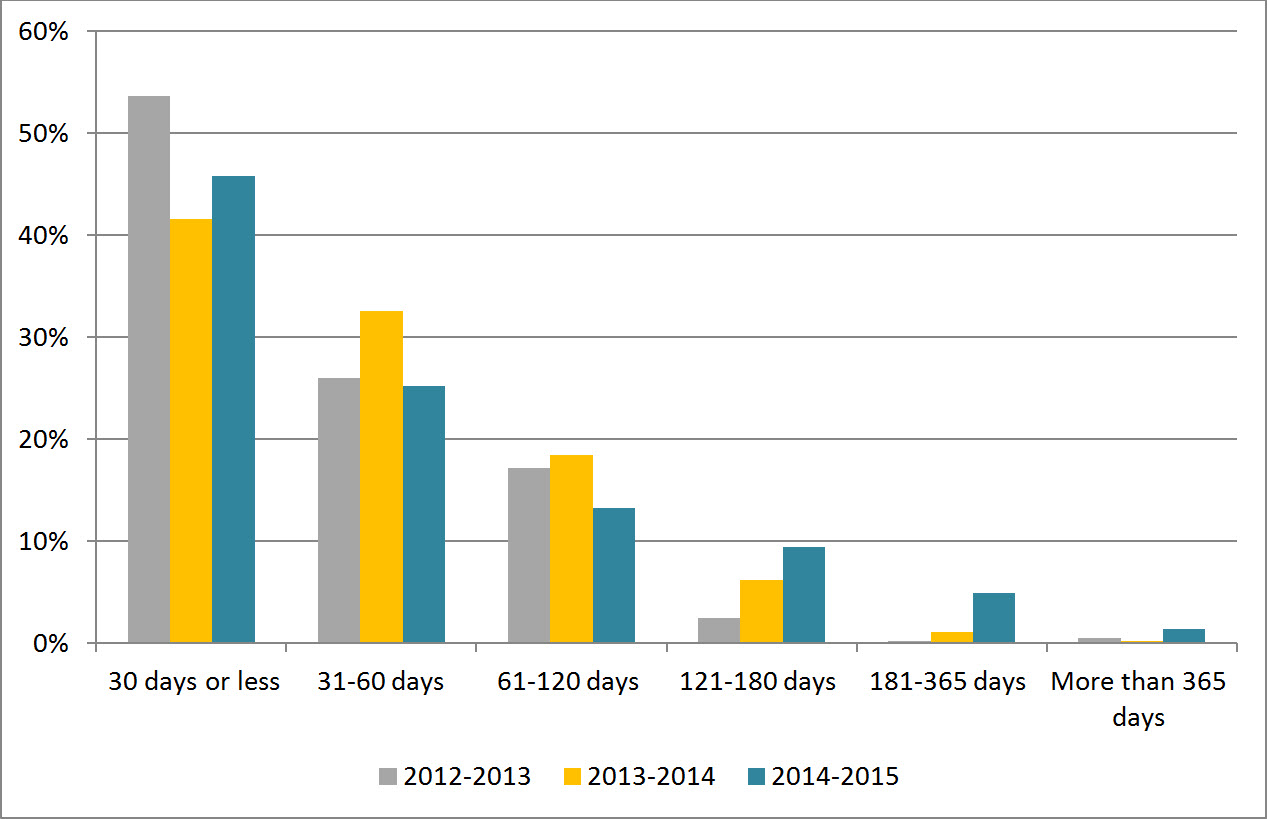
Figure 2 shows that 45.8% of the extensions taken in 2014-2015 were for 30 days or less. Also, the number of extensions between 31 and 60 days decreased from 32.5% in 2013-2014 to 25.2% in 2014-2015. A similar decrease was observed for extensions from 61 to 120 days. However, we note an increase in the percentage of requests extended beyond 121 days (15.7% in 2014-2015 compared to 7.5% in 2013-2014).
Figure 2: Length of Extensions
Text version
Figure 2 is a bar chart with vertical bars, representing the length of extensions taken by CBSA during each reporting period between 2012-2013 and 2014-2015. The results are as follows:
| Length of extensions | 2012-2013 | 2013-2014 | 2014-2015 |
|---|---|---|---|
| 30 days or less | 53.68% | 41.54% | 45.84% |
| 31-60 days | 25.98% | 32.55% | 25.17% |
| 61-120 days | 17.16% | 18.42% | 13.26% |
| 121-180 days | 2.45% | 6.21% | 9.44% |
| 181-365 days | 0.25% | 1.07% | 4.94% |
| More than 365 days | 0.49% | 0.21% | 1.35% |
Deemed refusals
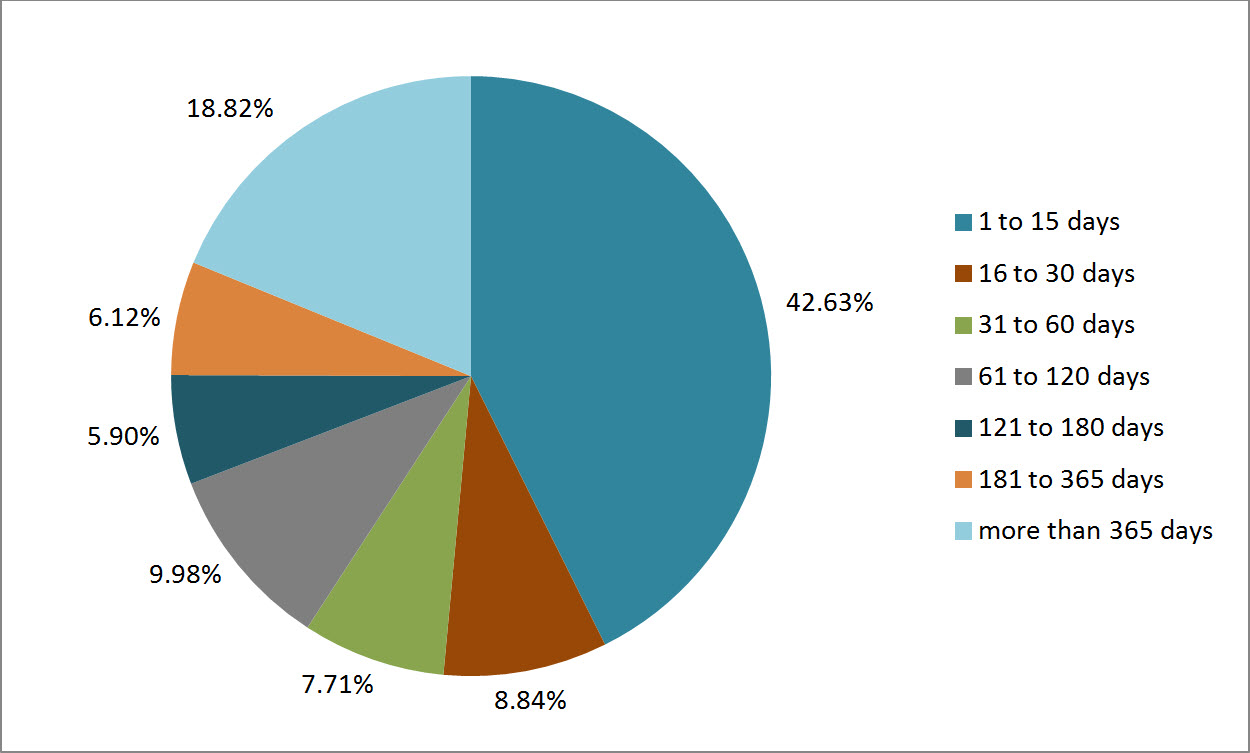
In 2014-2015, the number of requests closed past the statutory deadline was 441, which accounts for 6.5% of completed requests. This rate represents a “B” grade.Footnote 5 The main reason for not meeting the statutory deadline was workload (86.6%). Figure 3 shows that 42.6% of overdue requests were late by 15 days or less and that 51.5% of requests were late by 30 days or less. This is similar to the last period’s results.
Figure 3: Lateness of Overdue Requests
Text version
Figure 3 is a bar chart with vertical bars, representing the completion time by CBSA during each reporting period between 2012-2013 and 2014-2015. The results are as follows:
| Number of days | 2014-2015 |
|---|---|
| 1 to 15 days | 42.63% |
| 16 to 30 days | 8.84% |
| 31 to 60 days | 7.71% |
| 61 to 120 days | 9.98% |
| 121 to 180 days | 5.90% |
| 181 to 365 days | 6.12% |
| More than 365 days | 18.82% |
| Total | 100.0% |
Disclosure
Percentage of requests for which information was disclosed
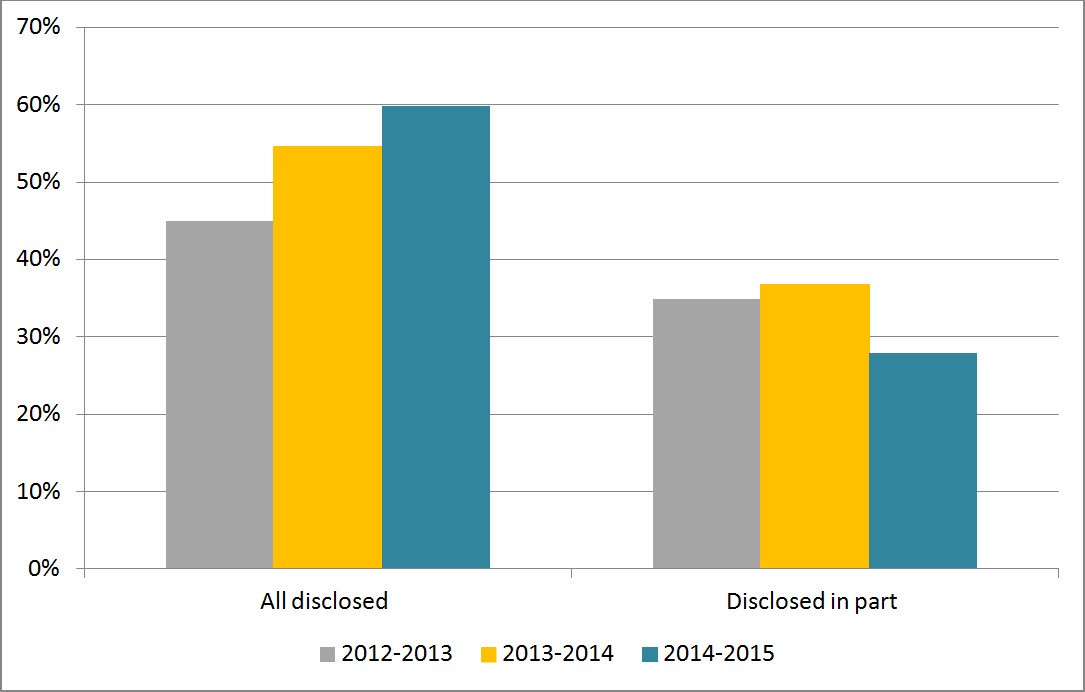
In 2014-2015, 59.8% of requests completed (6,802) were entirely disclosed, which is the highest disclosure rate since 2012 (see Figure 4). The rate for partially disclosed requests was 27.9% in 2014-2015, which is a decrease of 8.9% from the previous period.
Figure 4: Level of Disclosure
Text version
Figure 4 is a bar-chart with vertical bars, representing the entirely disclosed and disclosed in part requests as proportion of total requests completed by CBSA during each reporting period between 2012–2013 and 2014-2015. The results are as follows:
| Disclosure | 2012-2013 | 2013-2014 | 2014-2015 |
|---|---|---|---|
| All disclosed | 44.97% | 54.60% | 59.84% |
| Disclosed in part | 34.83% | 36.78% | 27.87% |
Exemptions
The average number of exemptions used per completed request decreased in 2014-2015 from 1.05 in 2013-2014 to 0.75 in 2014-2015 (see Table 2). The most used exemptions for this reporting period were section 16 (Law Enforcement and Investigations) (36.6%), section 19 (Personal Information) (29.2%), and section 15 (International Affairs and Defence) (12.2%).
Table 2: Exemptions
| Exemptions | 2012-2013 | 2013-2014 | 2014-2015 |
|---|---|---|---|
| Total number of exemptions | 2,983 | 4,298 | 5,121 |
| Total number of completed requests | 2,891 | 4,079 | 6,802 |
| Average number of exemptions per completed request | 1.03 | 1.05 | 0.75 |
Complaints at the OIC
The number of complaints receivedFootnote 6 against CBSA was 78 in 2014-2015 compared to 106 in the previous period. A substantial decrease is observed in the proportion of administrative complaints, which dropped from 46.2% in 2013-2014 to 28.2% in the current reporting period. In 2014-2015, 20 complaints were well-founded resolved, 9 were discontinued and 17 were pending resolution.