2013-2014 Privy Council Office
The mandate of the Privy Council Office (PCO) is to serve Canada and Canadians by providing professional, non-partisan advice and support to the Prime Minister, the ministers within the Prime Minister's portfolio and Cabinet. The Prime Minister is responsible for this organization. PCO supports the development of the Government of Canada's policy and legislative agendas, coordinates responses to issues facing the Government and the country, and supports the effective operation of Cabinet.
PCO received 907 requestsFootnote 1 during the reporting period 2013–2014, a 16% increase compared to 2012–2013 (780). PCO ranked tenth among the institutions in terms of requests received in 2013–2014, representing about 1.5% of all requests received. Since 2010–2011, requests received by PCO increased by 70%.
PCO’s performance was in general lower in 2013–2014 than in 2012–2013, especially in terms of timeliness.
Although PCO completed 772 requests in 2013–2014 (more than the previous year in terms of number), the completion rate decreased from 83% to 73%. As a result, a larger inventory of requests was carried over to the next fiscal year.
More than half of the requests received came from members of the media (64.8%). Other common sources of requests included the public (13%) and the private sector (11.4%). This is similar to the last reporting period.
In addition, PCO also released 652 previously released ATI packages in 2013–2014 (compared to 60 in 2012–2013).
Table 1. Workload
| Measures | Reporting Period 2012–2013 |
Reporting Period 2013–2014 |
Difference |
|---|---|---|---|
| Number of requests received | 780 | 907 | 16.28% |
| Number of consultations received (from other government institutions) | 511 | 422 | -17.42% |
| Average number of pages processed per request completed | 78 | 101 | 23 |
| % of requests for which more than 1,000 pages were processed | 1.07% | 1.56% | 0.49% |
| Note: The average number of pages processed per request completed and the percentage of requests for which more than 1,000 pages were processed are calculated from the total of requests completed for which the information was disclosed (in part or totally), exempted/excluded and for requests abandoned. It excludes requests completed for the following dispositions: no records exist, requests transferred and requests treated informally. | |||
PCO processed more pages in 2013–2014 with the average of pages per request completed going just over 100, compared to 78 in 2012–2013. However, most requests were for less than 100 processed pages (78%). Only 9 requests required the processing of more than 1,000 pages (compared to 5 requests in 2012–2013).
Timeliness
PCO responded to 390 requests within 30 days or less, which represents about 50.5% of the requests completed in 2013–2014 (a decrease of about 7.5% compared to 2012–2013). The proportion of requests completed in more than 120 days also went up for the second consecutive reporting period, from 1.9% in 2011–2012 to 10.6% in 2012–2013, and to 14.8% in 2013–2014. The average completion time also increased by 10 days (from 60 days in 2012–2013 to 70 days in 2013–2014).Footnote 2
PCO maintained the proportion of requests closed past the statutory or extended deadline low, with 17 requests closed late (representing 2.2% of all requests completed). This is equivalent to an “A”Footnote 3 grade. While this proportion increased compared to 2012–2013, it is below the results achieved government-wide (14% of requests closed late).
As for the reasons for requests past their statutory or extended deadline, 15 out of the 17 requests were said to be late because of the workload.
Extensions
Results in 2013–2014 showed a significant use of extensions by PCO. A total of 432 extensions were used, representing about 0.56 extension per request completed. This use of extensions may have contributed to PCO’s low deemed refusal rate.
Extensions in 2013–2014 also tended to be for longer period of time, as only 14.6% of them were for 30 days or less. This proportion was 24.5% in 2012–2013.
Figure 1. Length of extensions (2011–2012 to 2013–2014)
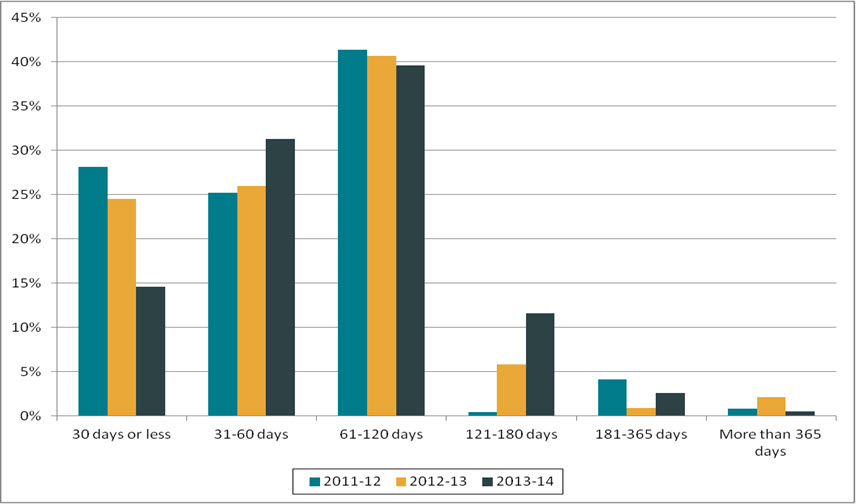
Text version
Figure 1 is a bar chart with vertical bars, representing the length of extensions taken by PCO during each reporting period between 2011–2012 and 2013–2014. The results are as follows:
| Reporting period | 30 days or less | 31-60 days | 61-120 days | 121-180 days | 181-365 days | More than 365 days |
|---|---|---|---|---|---|---|
| 2011–2012 | 28.10% | 25.21% | 41.32% | 0.41% | 4.13% | 0.83% |
| 2012–2013 | 24.46% | 25.99% | 40.67% | 5.81% | 0.92% | 2.14% |
| 2013–2014 | 14.58% | 31.25% | 39.58% | 11.57% | 2.55% | 0.46% |
Most of the extensions (56%) taken in 2013–2014 were related to section 9(1)(a) (interference with operations) due to “volume of records”. However, as noted earlier, only 9 requests required the processing of more than 1,000 pages.Footnote 4 An additional 37% of them were for consultations under section 9(1)(b). As for section 9(1)(c), 79.3% of the extensions were for more than 60 days. It is the Commissioner’s view that consultations with third parties usually take approximately 60 days.Footnote 5
As of note, PCO’s annual report indicates that the turnaround time for consultations with PCO Cabinet Confidences Counsel (PCO-CCC) for the review and certification of Cabinet confidences has significantly improved. They have received fewer responses past the deadline (from 77% in 2012–2013 to 12% in 2013–2014). Based on the report, 86% of the consultations were completed within 30 days.
Disclosure
Of the 780 requests completed, 2.1% of them were disclosed entirely, which represents a decrease compared to the reporting year 2012–2013 (4.8%). This is also the lowest disclosure rate achieved by the PCO over a 10-year period. It is also below the proportion government-wide (26.9%).
The number of requests for which no records existed represented 23.4% of the requests completed in 2013–2014. While this is similar to 2012–2013, it is significantly above the proportion government-wide result (10.5%).
More than half of the pages processed (57.6%) were disclosed in 2013–2014 (increased of 3.3% compared to 2012–2013). Finally, of note, all responses provided by PCO were in paper format. None were released electronically.
Exemptions/Exclusions
PCO applied a total of 1,226 exemptions and 229 exclusions in 2013–2014, representing a proportion of 1.88 exemptions/exclusions per request completed. In comparison, in 2012–2013, a total of 1.38 exemptions/exclusions per request completed were invoked.
Most applied exemptions in 2013–2014 included: section 21 (558 times) section 19 (267 times) and section 15 (166 times).
Table 2. Performance
| Measures | Reporting Period 2012–2013 |
Reporting Period 2013–2014 |
Difference | |
|---|---|---|---|---|
| Completion of Requests | ||||
| Completion rate | 83.24% | 73.31% | -9.93% | |
| Completion Time | ||||
| % of requests completed within 30 days | 58.07% | 50.52% | -7.55% | |
| Average number of days to complete a request | 60 | 70 | 10 | |
| % of requests closed past statutory or extended deadline | 0.28% | 2.20% | 1.92% | |
| % of consultations from government institution completed within 30 days | 60.33% | 56.97% | -3.36% | |
| % of extensions of 30 days or less | 24.46% | 14.58% | -9.88% | |
| Level of Disclosure | ||||
| % of pages processed that were disclosed | 54.29% | 57.62% | 3.33% | |
| % of requests completed for which the information was disclosed entirely | 4.83% | 2.07% | -2.76% | |
| % of pages disclosed entirely | 4.65% | 20.22% | 15.57% | |
| Exemptions/Exclusions | ||||
| Number of exemptions/exclusions per request completed | 1.38 | 1.88 | 0.50 | |
Other activities
In March 2013, PCO Access to Information and Privacy (ATIP) Office undertook a five-day problem-solving activity (Lean government “Kaisen”) aimed at improving client services. As a result, changes in the ATIP processes were made to “improve timeliness, reduce errors and paper use, and lessen demands on records-holders.”
Complaints
The number of complaints received against PCOFootnote 6 decreased by 4, from 52 complaints in 2012–2013 to 48 in 2013–2014.
The proportion of refusal complaints also decreased, representing 76.9% of complaints received in 2012–2013, it went down to 68.8% in 2013–2014.
Of the complaints received in 2013–2014 that were completed by April 2015 (19 were still pending), 18 were considered to be well founded, 9 were discontinued, 1 was not well-founded and 1 was settled.
Footnotes
- Footnote 1
-
According to the PCO’s annual report, the subject of the requests received varied. Notable subjects requested included the patriation of the Constitution, briefing notes to the Prime Minister for various time periods, Senate reform, and public opinion poll in.
- Footnote 2
-
Based on response to parliamentary written question Q-485.
- Footnote 3
-
The 2007–2008 OIC report card system was used to estimate a grade: A=0 to 5%, B=5 to 10%, C=10 to 15%, D=15 to 20%, F= more than 20%.
- Footnote 4
-
The OIC’s Advisory Notice on Time Extensions Pursuant to Paragraph 9(1)(a) of the Access to Information Act indicates that the OIC normally considers 1,000 pages of records or more as a benchmark for what constitutes a large number.
- Footnote 5
-
See the OIC's advisory notice on time extensions.
- Footnote 6
-
The numbers reported in this section are based on the OIC’s statistics. The information may not reflect the statistics reported by institutions due to the discrepancies in the methodology used.