2013-2014 Environment Canada
Environment Canada (EC) is responsible for preserving and enhancing the quality of the natural environment, conserving Canada’s renewable resources, conserving and protecting Canada’s water resources, forecasting weather and environmental change, enforcing rules relating to boundary waters, and coordinating environmental policies and programs for the federal government.
In 2013–2014, EC received 1,459 requests, a decrease of 20.1% compared to 2012–2013 (1,827 requests). EC is also the seventh ranked institution in terms of requests received under the Access to Information Act, representing about 2.4% of all requests received in 2013–2014. EC’s performance in terms of requests completed within 30 days was higher than in the previous reporting period. However, in terms of disclosure, EC’s results were below those achieved government-wide.
EC completed 86.5% of all requests in its inventory, which represents a decrease of about 4% compared to 2012–2013.
Most common categories of requesters in 2013–2014 included: the private sector (60%), the general public (15.9%) and the media (13.1%).
EC also received an additional 61 informal requests of previously released ATI packages in 2013–2014. This is similar to the last reporting period (66).
Table 1. Workload
| Measures | Reporting Period 2012–2013 | Reporting Period 2013–2014 | Difference |
|---|---|---|---|
| Number of requests received | 1,827 | 1,459 | -20.14% |
| Number of consultations received (from other government institutions) | 248 | 175 | -29.44% |
| Average number of pages processed per request completed | 153 | 295 | 142 |
| % of requests for which more than 1,000 pages were processed | 3.30% | 3.18% | -0.12% |
| Note: The average number of pages processed per request completed and the percentage of requests for which more than 1,000 pages were processed are calculated from the total of requests completed for which the information was disclosed (in part or totally), exempted/excluded and for requests abandoned. It excludes requests completed for the following dispositions: no records exist, requests transferred and requests treated informally. | |||
In 2013–2014, the volume of pages processed increased significantly (53.5%) despite receiving fewer requests. The average number of pages per request completed almost doubled, from 153 pages in 2012–2013 to 295 in 2013–2014.
Timeliness
EC responded to 1,074 requests within 30 days or less, or about 75.4% of all requests completed in 2013–2014. This proportion is about 10% higher than the one achieved in 2012–2013 and 16% above the government-wide proportion (60.98%). However, the proportion of requests completed in more than 120 days increased by 3.6% in 2013–2014 (12.2%).
Overall, EC took an average of 45 days to complete a request in 2013–2014 (similar to 2012–2013).
The proportion of requests closed past the statutory or extended deadline increased by less than1%, reaching 12.36% in 2013–2014. Of these, 96% had been extended. This proportion represents a “C” grade.Footnote 1 External consultations and workload were invoked as the principal reasons why deadlines were not met in 2013–2014, representing respectively 42% and 34% of the 176 requests late. About 41.5% of late requests exceeded the deadline by more than 120 days. In comparison, this proportion was about 24% in 2012–2013.
Extensions
A total of 476 extensions were taken in 2013–2014, an average of 0.33 extension per request completed. This proportion was higher in 2012–2013 (0.39).
Of 476 extensions taken in 2013–2014, 185 (39%) of them were for 30 days or less; 40% were for between 31 to 60 days. This is similar to the last reporting period’s results.
Figure 1. Length of extensions (2011–2012 to 2013–2014)
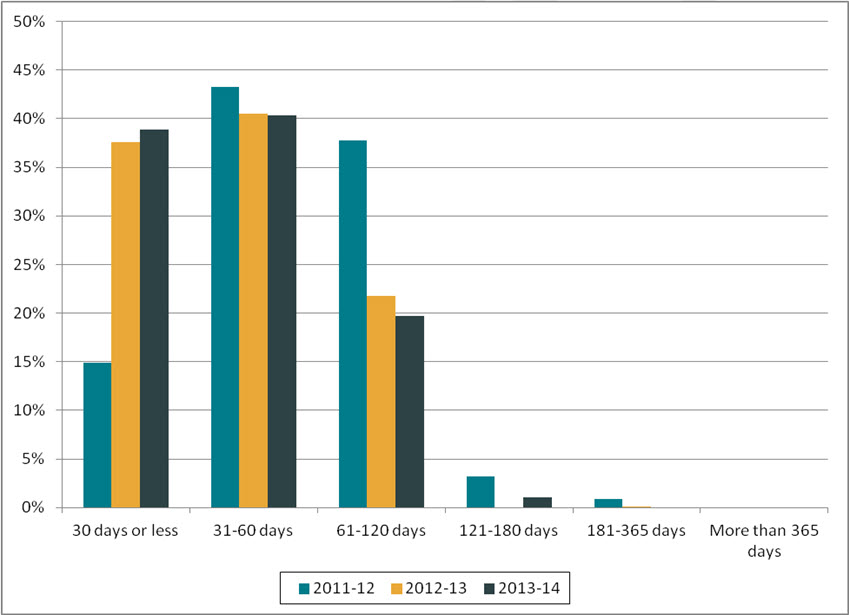
Text version
Figure 1 is a bar chart with vertical bars, representing the length of extensions taken by EC during each reporting period between 2011–2012 and 2013–2014. The results are as follows:
| Reporting period | 30 days or less | 31-60 days | 61-120 days | 121-180 days | 181-365 days | More than 365 days |
|---|---|---|---|---|---|---|
| 2011–2012 | 14.91% | 43.27% | 37.72% | 3.22% | 0.88% | 0.00% |
| 2012–2013 | 37.57% | 40.50% | 21.79% | 0.00% | 0.14% | 0.00% |
| 2013–2014 | 38.87% | 40.34% | 19.75% | 1.05% | 0.00% | 0.00% |
Most of the extensions were taken under paragraph 9(1)(a) (interference with operations), representing about 46% of all extensions taken in 2013–2014. An additional 35% of them were taken for consultations under paragraph 9(1)(b).
EC indicated in its annual report that it extended 218 requests due to the volume of records. However, looking at the number of relevant pages processed, only 20 requests required a high volume of pages (of 1,000 pages or more).Footnote 2
Disclosure
Of the 1,424 requests completed in 2013–2014, 9% were disclosed entirely, compared to 11% in 2012–2013. About half of the pages disclosed were disclosed entirely in 2013–2014. This is a significant improvement compared to 2012–2013, when 8.5% of pages were disclosed entirely.
The proportion of requests completed for which no records existed was 55.5% compared to 10.5% government-wide. This proportion is, however, similar to previous years.
Exemptions/Exclusions
A total of 801 exemptions and 134 exclusions were applied in 2013–2014, a proportion of 0.66 exemption/exclusion per request completed. In 2012–2013, this ratio was of 0.69.
Most applied exemptions in 2013–2014 included: government operations (309 times), personal information (216 times) and third party information (89 times).
Table 2. Performance
| Measures | Reporting Period 2012–2013 |
Reporting Period 2013–2014 |
Difference | |
|---|---|---|---|---|
| Completion of Requests | ||||
| Completion rate | 90.73% | 86.46% | -4.27% | |
| Completion Time | ||||
| % of requests completed within 30 days | 65.91% | 75.42% | 9.51% | |
| Average number of days to complete a request | 46 | 45 | -1 | |
| % of requests closed past statutory or extended deadline | 11.49% | 12.36% | 0.87% | |
| % of consultations from government institution completed within 30 days | 67.67% | 51.05% | -16.62% | |
| % of extensions of 30 days or less | 37.57% | 38.87% | 1.30% | |
| Level of Disclosure | ||||
| % of pages processed that were disclosed | 75.12% | 58.82% | -16.3% | |
| % of requests completed for which the information was disclosed entirely | 11.27% | 9.06% | -2.21% | |
| % of pages disclosed entirely | 8.45% | 51.51% | 43.06% | |
| Exemptions/Exclusions | ||||
| Number of exemptions/exclusions per request completed | 0.69 | 0.66 | -0.03 | |
Other activities
EC mentioned in its annual report that it developed a new guide for employees regarding the internal procedure for the suspected obstruction of the right of access.
EC joined the Treasury Board Secretariat’s Online Request Service Pilot Project in 2013–2014. Individuals can now submit requests to EC and pay the associated fees via the online portal.
Complaints
The OIC received 3 more complaints against ECFootnote 3 in 2013–2014 (29 complaints) than in 2012–2013 (26 complaints).
Complaints were mostly regarding refusal (19 complaints out of 29). An additional 10 complaints were related to administrative matters.
As of April 2015, 7 complaints were still pending. Of the completed complaints, 9 were well founded, 9 were settled and 3 were not well-founded. Finally, one of them was discontinued.
Footnotes
- Footnote 1
-
The 2007–2008 OIC report card grading system was used to estimate the grade: A=0 to 5%, B=5 to 10%, C=10 to 15%, D=15 to 20%, F=more than 20%.
- Footnote 2
-
The OIC has been considering 1,000 pages or more as benchmark for what constitutes a large volume of records. See advisory notice.
- Footnote 3
-
The numbers reported in this section are based on the OIC’s statistics. The information may not reflect the statistics reported by institutions due to the discrepancies in the methodology used.