2013-2014 Employment and Social Development Canada
Employment and Social Development Canada (ESDC) is the focal point for social policies and programs in Canada. The institution is responsible for strengthening Canada’s social foundations by fostering the welfare of citizens, families, and communities, as well as their participation in society.
ESDC received 861 new requests in 2013–2014, an increase of 15% compared to 746 requests in 2012–2013. Its performance was below the results achieved in 2012–2013, especially in terms of full disclosure of information.Footnote 1
In 2013–2014, ESDC completed 85.6% of all its requests in inventory (1,089). This completion rate represents a significant improvement from 2012–2013 (73.4%).
Requests received in 2013–2014 came mostly from 4 different categories of requesters: members of the public (36.2%), the private sector (23.6%), organizations (21.7%) and the media (17.9%).Footnote 2
ESDC also informally released 204 already released ATI packages in 2013-14. This is about 50 more packages than in 2012–2013 (154).
Table 1. Workload
| Measures | Reporting Period 2012–2013 | Reporting Period 2013–2014 | Difference |
|---|---|---|---|
| Number of requests received | 746 | 861 | 15.42% |
| Number of consultations received (from other government institutions) | 194 | 185 | -4.64% |
| Average number of pages processed per request completed | 205 | 128 | -77 |
| % of requests for which more than 1,000 pages were processed | 5.84% | 3.03% | -2.81% |
| Note: The average number of pages processed per request completed and the percentage of requests for which more than 1,000 pages were processed are calculated from the total of requests completed for which the information was disclosed (in part or totally), exempted/excluded and for requests abandoned. It excludes requests completed for the following dispositions: no records exist, requests transferred and requests treated informally. | |||
In terms of volume of pages, ESDC’s workload declined in 2013–2014 compared to 2012–2013. A majority of the requests closed (77.9%) required processing 100 pages or less. The average number of pages processed per request decreased, from 205 pages in 2012–2013 to 128 in 2013–2014.
Timeliness
ESDC responded to 447 requests within 30 days or less, which represents 48% of the requests completed during 2013–2014. This rate is approximately 2% lower than the rate in 2012–2013.
The proportion of requests closed past the statutory or extended deadline in 2013–2014 was of 9.3%, (most of them had been already extended (82%)). This proportion represents a “B” Grade.Footnote 3 In comparison, the proportion of late requests was 1.9% in 2011–2012 and 7.8% in 2012–2013.
Workload was identified as the principal reason for not meeting statutory or extended deadlines (53 out of 87 requests or 61%).
Extensions
ESDC took a total of 319 extensions to complete the 932 requests in 2013–2014, representing an average of 0.34 extension per request completed.
About 36% of extensions taken in 2013–2014 were for 30 days or less (an increase of 7% in 2012–2013).
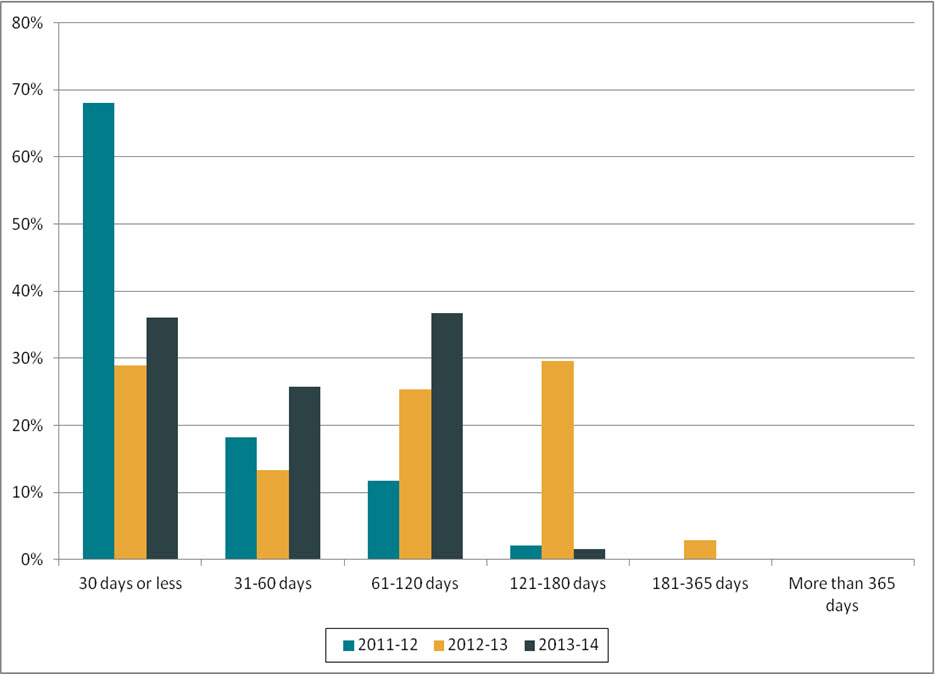
Figure 1. Length of extensions (2011–2012 to 2013–2014)
Text version
Figure 1 is a bar chart with vertical bars, representing the length of extensions taken by ESDC during each reporting period between 2011–2012 and 2013–2014. The results are as follows:
| Reporting period | 30 days or less | 31-60 days | 61-120 days | 121-180 days | 181-365 days | More than 365 days |
|---|---|---|---|---|---|---|
| 2011–2012 | 67.97% | 18.15% | 11.74% | 2.14% | 0.00% | 0.00% |
| 2012–2013 | 28.87% | 13.38% | 25.35% | 29.58% | 2.82% | 0.00% |
| 2013–2014 | 36.05% | 25.71% | 36.68% | 1.57% | 0.00% | 0.00% |
The majority of extensions in 2013–2014 were taken under section 9(1)(a) (interference with operations) (68.7%). This is similar to results observed in 2012–2013.
ESDC indicated in its annual report that it extended 319 requests due to the volume of records. However, looking at the number of relevant pages processed, only 24 requests required a high volume of pages (of 1,000 pages or more).Footnote 4
Disclosure
Of the 932 requests completed, 26.07% were disclosed entirely in 2013–2014, a decrease of 11% compared to 2012–2013.
However, a large portion of the pages processed were also disclosed (86%). This is similar to the last reporting period.
The proportion of requests completed for which no records existed was about 4% higher than the government-wide proportion (10.6%).
Exemptions/Exclusions
In 2013-14, a total of 1,202 exemptions and 42 exclusions were applied to withhold information, representing about 1.33 exemptions/exclusions per request completed. This proportion is higher than the one observed in 2012–2013 (1.18).
Most applied exemptions were as follows: personal information (368 times), third party information (239 times) and government operations (225 times).
Table 2. Performance
| Measures | Reporting Period 2012–2013 |
Reporting Period 2013–2014 |
Difference | |
|---|---|---|---|---|
| Completion of Requests | ||||
| Completion rate | 73.43% | 85.58% | 12.15% | |
| Completion Time | ||||
| % of requests completed within 30 days | 49.84% | 47.96% | -1.88% | |
| Average number of days to complete a request | N/A | N/A | N/A | |
| % of requests closed past statutory or extended deadline | 7.78% | 9.33% | 1.55% | |
| % of consultations from government institution completed within 30 days | 96.88% | 85.64% | -11.24% | |
| % of extensions of 30 days or less | 28.87% | 36.05% | 7.18% | |
| Level of Disclosure | ||||
| % of pages processed that were disclosed | 86.65% | 85.76% | -0.89% | |
| % of requests completed for which the information was disclosed entirely | 36.83% | 26.07% | -10.76% | |
| % of pages disclosed entirely | 8.57% | 11.53% | 2.96% | |
| Exemptions/Exclusions | ||||
| Number of exemptions/exclusions per request completed | 1.18 | 1.33 | 0.15 | |
Other activities
ESDC undertook a “Business Process Redesign” of the ATIP administrative process in order to streamline it and find new innovative and efficient ways of processing requests. Some minor changes were implemented. A working group was analyzing the efficiency of other innovative solutions that could be implemented in the future.
Complaints
The number of complaints received by the OIC against ESDCFootnote 5 went up from 23 in 2012–2013 to 37 in 2013–2014.
From the complaints received in 2013–2014, about 62.2% of them were administrative complaints (compared to 45% in 2012–2013).
As for the disposition, 6 were well-founded, 4 were not well-founded and 2 were settled. An additional 4 complaints were discontinued, while 21 complaints were still pending as of April 2015.
Footnotes
- Footnote 1
-
ESDC mentioned in its annual report 2013–2014 that multiple experienced employees retired during the reporting period, restraining its capacity to maintain its performance.
- Footnote 2
-
According to ESDC’s annual report, typical requests in 2013–2014 included those for statistics on the Department’s programs, briefing notes, research and studies of interest to the ESDC portfolio, and requests from employers or their representative for records regarding their own applications under the Temporary Foreign Worker Program.
- Footnote 3
-
The 2007–2008 OIC report card grading system was used to estimate the grade: A=0 to 5%, B=5 to 10%, C=10 to 15%, D=15 to 20%, F=more than 20%.
- Footnote 4
-
The OIC has been considering 1,000 pages or more as bench mark for what constitutes a large volume of records. See advisory notice.
- Footnote 5
-
The numbers reported in this section are based on the OIC’s statistics. The information may not reflect the statistics reported by institutions due to the discrepancies in the methodology used.