2013-2014 National Defence
The Department of National Defence (DND) complements the role of the Canadian Forces and is responsible for policy, resources, interdepartmental coordination and international defence relations. The Canadian Forces command, control and administer all military strategies, plans and requirements.
In 2013–2014, DND received 2,231 requests, an increase of 9.2% compared to 2012–2013 (2,044 requests). DND was also the fourth institution in terms of requests received in 2013–2014, representing close to 4% of all requests received. In general, DND’s performance in 2013–2014 was below government-wide results, especially in terms of timeliness.
DND completed 79.8% of all requests in its inventory in 2013–2014, which is similar to the completion rate achieved in 2012–2013 (79.98%). National Defence started the reporting period 2013–2014 with a larger carryover of requests (550 requests). Despite completing about 21% more requests in 2013–2014 (and receiving 19.4% less consultation requests), 562 requests were carried over to 2014–2015.
The average time to complete a request was 79.9 days in 2013–2014, an increase of nearly 17 days compared to the average achieved in 2012–2013.Footnote 1
Just over half of the requests received in 2013–2014 came from the media (1,105 or 49.5%), followed by the public (594 or 26.6%). Similar proportions were observed in 2012–2013.
Table 1. Workload
| Measures | Reporting Period 2012–2013 | Reporting Period 2013–2014 | Difference |
|---|---|---|---|
| Number of requests received | 2,044 | 2,231 | 9.15% |
| Number of consultations received (from other government institutions) | 489 | 394 | -19.43% |
| Average number of pages processed per request completed | 104 | 123 | 19 |
| % of requests for which more than 1,000 pages were processed | 1.58% | 2.52% | 0.94% |
| Note: The average number of pages processed per request completed and the percentage of requests for which more than 1,000 pages were processed are calculated from the total of requests completed for which the information was disclosed (in part or totally), exempted/excluded and for requests abandoned. It excludes requests completed for the following dispositions: no records exist, requests transferred and requests treated informally. | |||
The volume of pages processed increased from 156,813 pages in 2012–2013 to 234,134 in 2013–2014, representing a 49% increase. In general, requests closed in 2013–2014 required processing a higher volume of pages. The average number of pages processed per request went up by 19 pages, from 104 pages per request in 2012–2013 to 123 in 2013–2014.
Timeliness
DND responded to 922 requests within 30 days or less, which represents 41.6% of all requests completed in 2013–2014. This is low compared to the government-wide proportion (61%). The proportion of requests completed after more than 120 days was also higher in 2013–2014 (21.6%) when compared to the previous reporting period (13.3%).
The proportion of requests closed past the statutory or extended deadline also increased in 2013–2014 as compared to 2012–2013, from 5.8% to 9.4% (94.3% of late requests were extended requests). This rate represents a “B” grade.Footnote 2
Workload was invoked as the principal reason for not meeting statutory deadlines (38.3% of the time).
Additionally, a higher proportion of requests closed past statutory deadlines were late by more than 120 days in 2013–2014 (30.6%) compared to 2012–2013 (28%).
Extensions
DND took 1,462 extensions to complete 2,219 requests in 2013–2014. This represents a ratio of 0.66 extension per request. This ratio is similar to that of the previous year but is well above the government-wide ratio.
About half of the extensions (56.5%) in 2013–2014 were taken under section 9(1)(a) (interference with operations). This proportion was similar in 2012–2013. Although DND indicates that the use of 9(1)(a) result from an increase in workload combined with available resources, the Act provides that institutions may extend the 30-day time limit under this section to respond to a request if it is for a large number of records or necessitates a search through a large number of records and meeting the original time limit would unreasonably interfere with the operations of the institution. Based on the statistical report, only 48 requests required the processing of more than 1,000 pages.Footnote 3
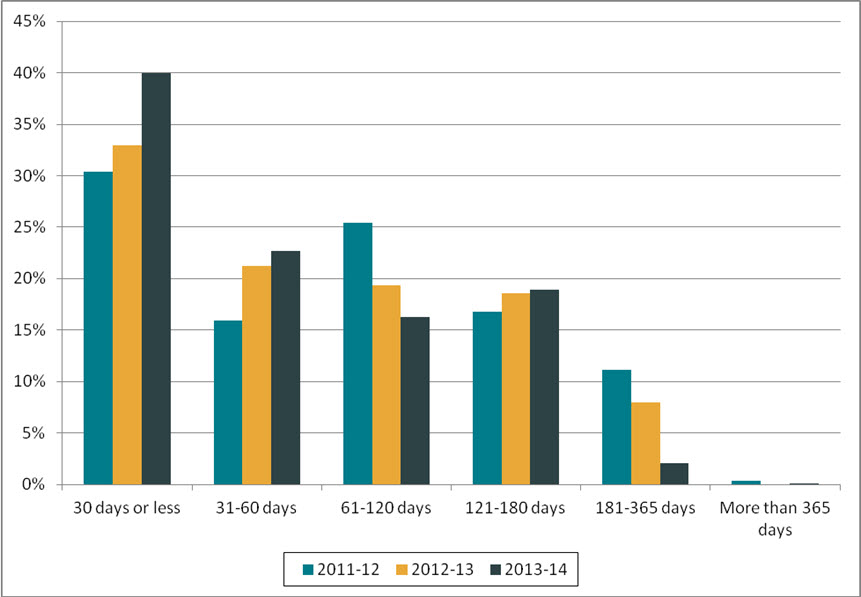
Extensions of 30 days or less accounted for about 39.9% of all extensions taken (an increase of 5% compared to 2012–2013). Extensions taken for consultations under paragraph 9(1)(b) were for longer periods, with 75.79% of them being for more than 60 days (similar finding observed in 2012–2013).
Figure 1. Length of extensions (2011–2012 to 2013–2014)
Text version
Figure 1 is a bar chart with vertical bars, representing the length of extensions taken by DND during each reporting period between 2011–2012 and 2013–2014. The results are as follows:
| Reporting period | 30 days or less | 31-60 days | 61-120 days | 121-180 days | 181-365 days | More than 365 days |
|---|---|---|---|---|---|---|
| 2011–2012 | 30.37% | 15.93% | 25.45% | 16.78% | 11.16% | 0.31% |
| 2012–2013 | 32.97% | 21.21% | 19.30% | 18.56% | 7.95% | 0.00% |
| 2013–2014 | 39.95% | 22.71% | 16.28% | 18.95% | 2.05% | 0.07% |
Disclosure
Of the 2,219 requests completed, 24.3% resulted in full disclosure of the information requested (an improvement from 19.25% in 2012–2013). While the proportion of pages processed that were disclosed went down in 2013–2014 (from 86.8% to 79.2%), it was still significantly above the government-wide proportion (40.2%).
Exemptions/Exclusions
In 2013–2014, a total of 2,864 exemptions and 445 exclusions were applied to complete 2,219 requests, a proportion of 1.49 exemptions/exclusions per request completed. In 2012–2013, this proportion was of 1.27.
The top exemptions in 2013–2014 were: international affairs/defence (728 requests), operations of government (617 requests) and personal information (539 requests). This is similar to 2012–2013.
Table 2. Performance
| Measures | Reporting Period 2012–2013 |
Reporting Period 2013–2014 |
Difference | |
|---|---|---|---|---|
| Completion of Requests | ||||
| Completion rate | 76.98% | 79.79% | 2.81% | |
| Completion Time | ||||
| % of requests completed within 30 days | 48.29% | 41.55% | -6.74% | |
| Average number of days to complete a request | 63.1 | 79.9 | 16.8 | |
| % of requests closed past statutory or extended deadline | 5.82% | 9.42% | 3.6% | |
| % of consultations from government institution completed within 30 days | 49.79% | 49.88% | 0.09% | |
| % of extensions of 30 days or less | 32.97% | 39.95% | 6.98% | |
| Level of Disclosure | ||||
| % of pages processed that were disclosed | 86.76% | 79.16% | -7.60% | |
| % of requests completed for which the information was disclosed entirely | 19.25% | 24.29% | 5.04% | |
| % of pages disclosed entirely | 23.26% | 17.81% | -5.45% | |
| Exemptions/Exclusions | ||||
| Number of exemptions/exclusions per request completed | 1.27 | 1.49 | 0.22 | |
Other activities
In 2013–2014, DND’s ATIP office conducted Business Process reviews in order to streamline ATIP processes, identify and eliminate duplicates and locate areas of improvement. Final results of changes made following this process should become apparent in 2014–2015.
DND also worked on a new Defence Administrative Order and Directive which, once approved and implemented, will provide direction on the administration of the Act.
The ATIP office also monitors ATI-related activities on a monthly basis. The ATIP coordinator receives updates on various indicators, such as the number of requests completed and the number of complaints received during the specific month. It then provides information to the Corporate Secretary every quarter.
Complaints
The number of complaints against DNDFootnote 4 increased by 65.3% in 2013–2014 (119 complaints) compared to the previous reporting period (72 complaints).
Most of them (78) were refusal complaints (65.5%). This is proportionally similar to 2012–2013 (72 or 63.9%).
A total of 37 complaints received in 2013–2014 were resolved as well founded, 26 were settled and 14 were not well-founded. An additional 23 complaints were discontinued, while 19 were still pending as of April 2015.
Footnotes
- Footnote 1
-
Based on response to parliamentary written question Q-485.
- Footnote 2
-
The 2007–2008 OIC report card system was used to estimate a grade: A= 0 to 5%; B= 5 to 10%; C= 10 to 15%; D=15 to 20%, F= more than 20%.
- Footnote 3
-
The OIC’s Advisory Notice on Time Extensions Pursuant to Paragraph 9(1)(a)of the Access to Information Act indicates that the OIC normally considers 1,000 pages of records or more as a benchmark for what constitutes a large number. The data on the volume of pages searched per request is not available.
- Footnote 4
-
The numbers reported in this section are based on the OIC’s statistics. The information may not reflect the statistics reported by institutions due to the discrepancies in the methodology used.