2013-2014 Department of Finance Canada
The Department of Finance Canada (Fin) develops policies and provides advice to the government that support and contribute to economy of the country. This includes preparing the annual budget, analyzing and designing tax policies and administering funds transfer to the provinces and territories.
In 2013–2014, Fin received 547 requests, representing an increase of 10.5% compared to 2012–2013. In terms of completion time, Fin was able to complete more requests within 30 days this year. However, the proportion of requests disclosed in their entirety is still low. In general, results were below government-wide performance, except for the proportion of requests closed past the statutory or extended deadline.
From an inventory of 654 requests, Fin completed 573 of them in 2013–2014, a completion rate of 87.6% (compared to 81.1% in 2012–2013).
Requests received in 2013–2014 came primarily from the media (329, 60.1%). The proportion of requests received from this category increased by 16.6% since 2012–2013. Other categories of requesters in 2013–2014 included the private sector (17.7 %) and the public (12.8%).
Fin reported receiving a total of 627 informal requests for already released packages in 2013–2014. This is 159% more than in 2012–2013 (242 informal requests).
Table 1. Workload
| Measures | Reporting Period 2012–2013 |
Reporting Period 2013–2014 |
Difference |
|---|---|---|---|
| Number of requests received | 495 | 547 | 10.51% |
| Number of consultations received (from other government institutions) | 261 | 189 | -27.59% |
| Average number of pages processed per request completed | 135 | 130 | -5 |
| % of requests for which more than 1,000 pages were processed | 2.23% | 2.75% | 0.52% |
| Note: The average number of pages processed per request completed and the percentage of requests for which more than 1,000 pages were processed are calculated from the total of requests completed for which the information was disclosed (in part or totally), exempted/excluded and for requests abandoned. It excludes requests completed for the following dispositions: no records exist, requests transferred and requests treated informally. | |||
In terms of volume of pages, the workload per request represented on average 130 pages, a decrease of 5 pages per request. 13 requests completed (2.75%) were for more than 1,000 pages. In 2012–2013, there were 8 requests in this category.
Timeliness
Fin completed proportionally more requests within 30 days in 2013–2014 (56.7%) than in 2012–2013 (42.4%). The average time to complete a request also decreased significantly from 66 days to 39 days.Footnote 1
Fin closed about 46 requests past the statutory or extended deadline, representing about 8% of all requests completed in 2013–2014 (an increase of 1.6% compared to 2012–2013). This rate represents a “B” grade.Footnote 2
Extensions
In 2013–2014, the number of extensions applied was similar to the one in 2012–2013 (increase of 3 extensions).
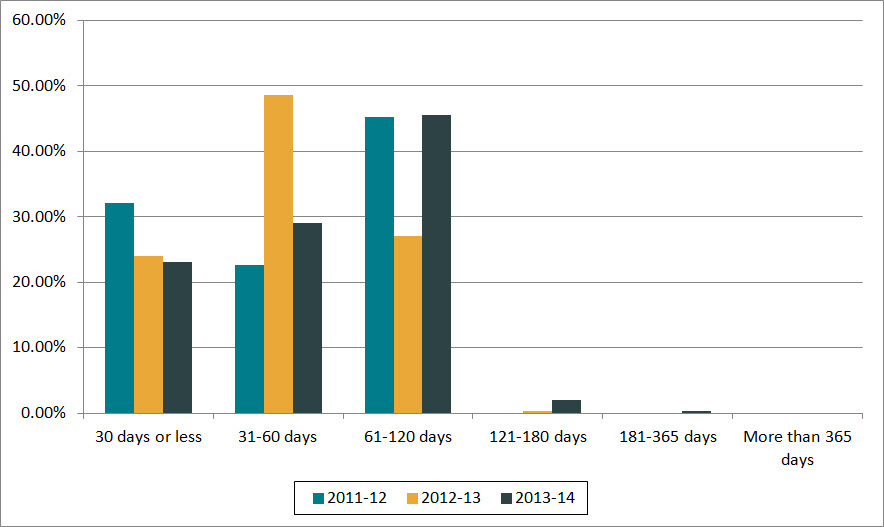
More than half of the extensions (63.2%) taken in 2013–2014 were under section 9(1)(b) (consultation). The number of extensions for consultations related to Cabinet Confidences increased significantly, from 34 extensions in 2012–2013 to 86 in 2013–2014 (+153%). The vast majority of these extensions were for 61 to 120 days, as it can be observed in Figure 1.
The proportion of extensions for 30 days or less was similar to 2012–2013 (23-24%).
Figure 1. Length of extensions (2011–2012 to 2013–2014)
Text version
Figure 1 is a bar chart with vertical bars, representing the length of extensions taken by Fin during each reporting period between 2011–2012 and 2013–2014. The results are as follows:
| Reporting period | 30 days or less | 31-60 days | 61-120 days | 121-180 days | 181-365 days | More than 365 days |
|---|---|---|---|---|---|---|
| 2011–2012 | 32.08% | 22.64% | 45.28% | 0.00% | 0.00% | 0.00% |
| 2012–2013 | 23.99% | 48.65% | 27.03% | 0.34% | 0.00% | 0.00% |
| 2013–2014 | 23.08% | 29.10% | 45.48% | 2.01% | 0.33% | 0.00% |
Disclosure
Of the requests completed in 2013–2014, 9.8% were disclosed entirely, which represents a decrease compared to 2012–2013 (12%). This is also below the government-wide disclosure rate of 26.9%.
Fin also disclosed 36,941 pages in 2013–2014, which represents about 60% of the pages processed. This proportion is above the government-wide figure of 53.4%.
For 17% of requests in 2013–2014, Fin responded that no records existed. In comparison, 10.5% of the requests completed government-wide resulted in no records during the same period.
Exemptions/Exclusions
Fin applied a total of 1,846 exemptions and 266 exclusions in 2013–2014, representing a proportion of 3.69 exemptions/exclusions per request completed. This is significantly above the government-wide proportion, which was at 1.18 in 2013–2014.
Most applied exemptions in 2013–2014 included: section 21 (625 times) section 20 (209 times) and section 18 (334 times).
Table 2. Performance
| Measures | Reporting Period 2012–2013 |
Reporting Period 2013–2014 |
Difference | |
|---|---|---|---|---|
| Completion of Requests | ||||
| Completion rate | 81.06% | 87.61% | 6.55% | |
| Completion Time | ||||
| % of requests completed within 30 days | 42.36% | 56.72% | 14.36% | |
| Average number of days to complete a request | 66 | 39 | -27 | |
| % of requests closed past statutory or extended deadline | 7.64% | 8.03% | 0.39% | |
| % of consultations from government institution completed within 30 days | 82.22% | 82.72% | 0.50% | |
| % of extensions of 30 days or less | 23.99% | 23.08% | -0.91% | |
| Level of Disclosure | ||||
| % of pages processed that were disclosed | 62.85% | 60.08% | -2.77% | |
| % of requests completed for which the information was disclosed entirely | 12.23% | 9.77% | -2.46% | |
| % of pages disclosed entirely | 4.71% | 5.82% | 1.11% | |
| Exemptions/Exclusions | ||||
| Number of exemptions/exclusions per request completed | 3.23 | 3.69 | 0.46 | |
Other activities
In the wake of the new process put in place for consultation regarding the Cabinet Confidence documents,Footnote 3 Fin ensured that all ATIP and Departmental Legal Services Unit (DLSU) employees were trained appropriately on this new process.
Fin’s ATIP office also provided training to 34 new employees.
Complaints
A total of 19 complaints were received by the OIC against FinFootnote 4 in 2013–2014. This is 2 complaints more than in 2012–2013.
Most of them were refusal complaints (14 out of 19). This is also similar to the last reporting period.
Of the complaints registered in 2013–2014, 2 were still pending as of April 2015, 5 were well-founded, 5 more were not well-founded, one was settled and 6, discontinued.
Footnotes
- Footnote 1
-
Based on response to parliamentary written question Q-485.
- Footnote 2
-
The 2007–2008 OIC report card grading system was used to estimate the grade: A=0 to 5%, B= 5 to 10%, C=10 to 15%, D=15% to 20%, F=more than 20%.
- Footnote 3
-
According to the new process, ATIP offices must consult with their respective DLSU, instead of PCO, for confirming Cabinet Confidences.
- Footnote 4
-
The numbers reported in this section are based on the OIC’s statistics. The information may not reflect the statistics reported by institutions due to the discrepancies in the methodology used.