2013-2014 Canadian Food Inspection Agency
The Canadian Food Inspection Agency (CFIA) provides inspection services and regulatory oversight for food production, plant and animal health products, and delivers consumer protection programs relating to the food system in Canada. CFIA enforces Health Canada policies and standards governing the safety and nutritional quality of all food sold in Canada and verifies industry compliance with federal acts and regulations.
In 2013–2014, CFIA received 284 requests, a decrease of 30% compared to 2012–2013 (405 requests). This is however similar to the number of requests received in 2011–2012.
CFIA’s performance was significantly below the government-wide levels in 2013–2014, especially in terms of requests closed past the statutory or extended deadline.
Despite receiving fewer requests, CFIA completed only 63.6% of all requests in its inventory in 2013–2014. This is significantly below the government-wide completion rate (84%). According to CFIA, this is mostly due to the departure of two full-time employees in 2013–2014.
Three categories of requesters submitted the majority of requests received in 2013–2014: the private sector (32.0%), members of the public (29.6%) and the media (27.1%).
Table 1. Workload
| Measures | Reporting Period 2012–2013 | Reporting Period 2013–2014 | Difference |
|---|---|---|---|
| Number of requests received | 405 | 284 | -29.88% |
| Number of consultations received (from other government institutions) | 99 | 99 | 0 |
| Average number of pages processed per request completed | 161 | 233 | 72 |
| % of requests for which more than 1,000 pages were processed | 3.70% | 5.98% | 2.28% |
| Note: The average number of pages processed per request completed and the percentage of requests for which more than 1,000 pages were processed are calculated from the total of requests completed for which the information was disclosed (in part or totally), exempted/excluded and for requests abandoned. It excludes requests completed for the following dispositions: no records exist, requests transferred and requests treated informally. | |||
While the number of requests completed decreased compared to 2012–2013, the volume of pages processed continues to grow (increase of 12.3%). Additionally, the proportion of requests that required processing more than 1,000 pages went up from 3.7% to 6% in 2013–2014.
Timeliness
CFIA responded to 96 requests within 30 days or less in 2013–2014, which represents 35.16% of all requests completed. This proportion is well below the one achieved government-wide (60.98%).
The proportion of requests of more than 120 days also increased significantly, from 16.62% in 2012–2013 to 37.36% in 2013–2014. This was also reflected in the average time to complete a request, which more than doubled compared to the average in 2012–2013 (from 83 to 169 days).Footnote 1
Almost half of the requests completed (47.25%) were closed past the statutory or extended deadline in 2013–2014, an increase compared to 2012–2013 (27.04%). This proportion represents an “F” grade.Footnote 2 Workload was identified as the principal reason why requests were late (77.5% of the time).
Extensions
In 2013–2014, 208 of extensions were taken by CFIA, a proportion of 0.76 extension per request completed. As a comparison, this ratio is 0.26 government-wide.
The proportion of extensions for 30 days or less went up from about 6.3% in 2012–2013 to 18.8% in 2013–2014. Most of extensions took between 31 and 60 days (58.65% in 2013–2014).
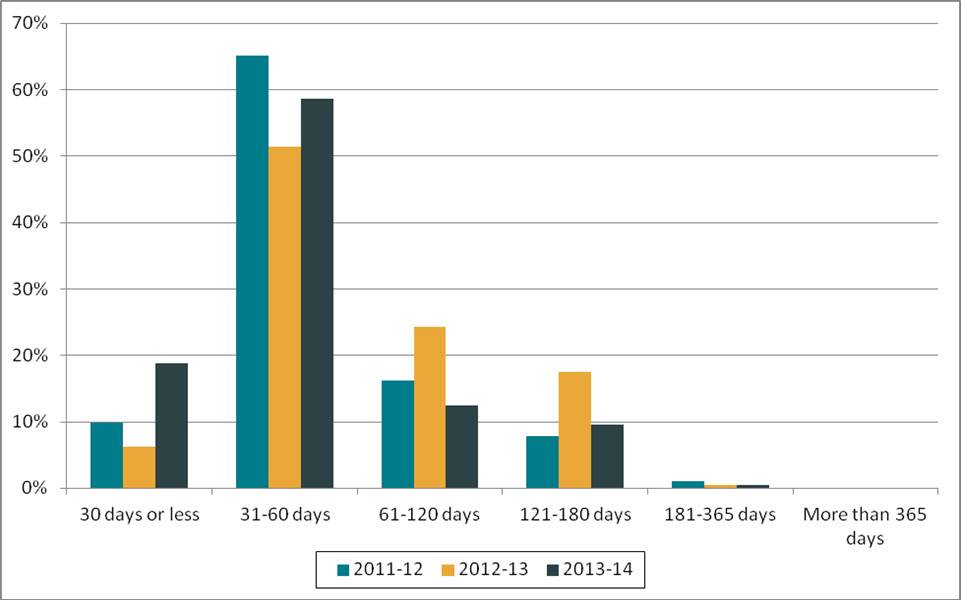
Figure 1. Length of extensions (2011–2012 to 2013–2014)
Text version
Figure 1 is a bar chart with vertical bars, representing the length of extensions taken by CFIA during each reporting period between 2011–2012 and 2013–2014. The results are as follows:
| Reporting period | 30 days or less | 31-60 days | 61-120 days | 121-180 days | 181-365 days | More than 365 days |
|---|---|---|---|---|---|---|
| 2011–2012 | 9.80% | 65.20% | 16.18% | 7.84% | 0.98% | 0.00% |
| 2012–2013 | 6.28% | 51.46% | 24.27% | 17.57% | 0.42% | 0.00% |
| 2013–2014 | 18.75% | 58.65% | 12.50% | 9.62% | 0.48% | 0.00% |
About half (50.96%) of extensions taken in 2013–2014 were for consultations under section 9(1)(c). This is similar to the last reporting period.
Disclosure
Requests resulting in the entire disclosure of information represented 13.2% of the requests completed in 2013–2014 (an improvement from 11% in 2012–2013). It is well below the proportion achieved government-wide in 2013–2014 (26.9%).
For the second consecutive year, the number of abandoned requests represented a significant proportion of all requests completed (31% in 2012–2013 and 28% in 2013–2014).
Exemptions/Exclusions
A total of 458 exemptions and 8 exclusions were applied to requests completed in 2013–2014. This represents a proportion of 1.71 exemptions/exclusions per request completed. This is higher than in 2012–2013, where the ratio was 1.26 exemptions/exclusions per request completed.
Table 2. Performance
| Measures | Reporting Period 2012–2013 |
Reporting Period 2013–2014 |
Difference | |
|---|---|---|---|---|
| Completion of Requests | ||||
| Completion rate | 71.00% | 63.64% | -7.36% | |
| Completion Time | ||||
| % of requests completed within 30 days | 43.67% | 35.16% | -8.51% | |
| Average number of days to complete a request | 83 | 169 | +86 | |
| % of requests closed past statutory or extended deadline | 27.04% | 47.25 | +20.21% | |
| % of consultations from government institution completed within 30 days | 80.21% | 83.5% | +3.29% | |
| % of extensions of 30 days or less | 6.28% | 18.75% | +12.47% | |
| Level of Disclosure | ||||
| % of pages processed that were disclosed | 64.76% | 47.36% | -17.40% | |
| % of requests completed for which the information was disclosed entirely | 10.99% | 13.19% | +2.20% | |
| % of pages disclosed entirely | 2.77% | 26.17% | +23.4% | |
| Exemptions/Exclusions | ||||
| Number of exemptions/exclusions per request completed | 1.26 | 1.71 | 0.45 | |
Other activities
In January 2014, CFIA joined other institutions in accepting requests via the online ATIP requests portal. Individuals can submit requests for information to CFIA and pay the application fees online.
In March 2014, CFIA’s ATIP office carried out a review of its internal business process in order to identify and resolve weaknesses and inefficiencies. A new team, the Outstanding ATIP Task Process, was also created at the end of the fiscal year to “ensure greater accountability towards the timely completion of search and retrieval tasks”. As a result of these changes, CFIA expects that the overall delivery of services will be enhanced by 2014–2015.
Complaints
The number of complaints registered against CFIAFootnote 3 went down in 2013–2014 (11 complaints) compared to 2012–2013 (26 complaints).
Complaints registered in 2013–2014 were for refusal (4 complaints) and administrative matters (7 complaints). This is proportionally similar to 2012–2013.
As of April 2015, 6 of the 11 complaints registered in 2013–2014 were found to be well-founded, 2 not well-founded, while 3 still pending.
Footnotes
- Footnote 1
-
Based on response to parliamentary written question Q-485.
- Footnote 2
-
The 2007–2008 OIC report card grading system was used to estimate the grade: A=0 to 5%, B= 5 to 10%, C=10 to 15%, D=15% to 20%, F=more than 20%.
- Footnote 3
-
The numbers reported in this section are based on the OIC’s statistics. The information may not reflect the statistics reported by institutions due to the discrepancies in the methodology used.