2013-2014 Aboriginal Affairs and Northern Development Canada
Aboriginal Affairs and Northern Development Canada (AANDC) is responsible for meeting the Government of Canada’s obligations and commitments to First Nations, Inuit and Métis, and for fulfilling the federal government’s constitutional responsibilities in the North.
AANDC received 14% fewer requests in 2013–2014 compared to the previous reporting period. The average number of pages processed per request also went down by 90 pages. Despite these decreases, AANDC‘s performance was somewhat lower compared to 2012–2013, even though the institution was able to respond to all completed requests within statutory or extended timelines.
Amongst all of the requests in its inventory (657), AANDC completed 586 requests in 2013–2014, which is a completion rate of 89.2% (compared to 85.2% in 2012–2013).
The media was the primary source of requests received in 2013–2014 (41.2%). The proportion of requests received from members of the public was down from 59.6% in 2012–2013 to 38% in 2013–2014. According to the AANDC’s annual report, journalists mostly requested records related to high-profile topics.Footnote 1
AANDC also processed 82 requests of previously released ATI packages.
Table 1. Workload
| Measures | Reporting Period 2012–2013 |
Reporting Period 2013–2014 |
Difference |
|---|---|---|---|
| Number of requests received | 648 | 556 | -14.20% |
| Number of consultations received (from other government institutions) | 209 | 168 | -19.62% |
| Average number of pages processed per request completed | 801 | 711 | -90 |
| % of requests for which more than 1,000 pages were processed | 11.07% | 13.82% | 2.75% |
| Note: The average number of pages processed per request completed and the percentage of requests for which more than 1,000 pages were processed are calculated from the total of requests completed for which the information was disclosed (in part or totally), exempted/excluded and for requests abandoned. It excludes requests completed for the following dispositions: no records exist, requests transferred and requests treated informally. | |||
In terms of volume of pages processed, 13.8% of requests (63) required processing 1,000 pages or more, compared to 11.07% in 2012–2013. About half of the requests completed required processing 100 pages or fewer.
As for the complexity of requests, 189 of the requests completed required consultations and 15 required assessing fees. There was also a significant number of requests (252) that were included in the “other” category in terms of complexity.Footnote 2
Timeliness
Approximately 63% of the requests completed in 2013–2014 were completed within 30 days, which represents a small decrease compared to the proportion achieved in 2012–2013 (69%). Of these, 45% were for requests that yielded no records or were abandoned. The percentage of requests completed in more than 120 days doubled compared to the previous year, from 7.2% in 2012–2013 to 14.5% in 2013–2014.
These results are consistent with the response given to a parliamentary question, which shows that the average time to complete a request increased from 47 days in 2012–2013 to 53 days in 2013–2014.Footnote 3
However, AANDC was able to complete them all within their statutory or extended deadline. As such, for the second consecutive year, there were no requests completed past the statutory or extended deadline in 2013–2014 which earned AANDC an “A” grade.Footnote 4 AANDC reports that it has responded to all requests on time since the second quarter of 2011–2012.
Extensions
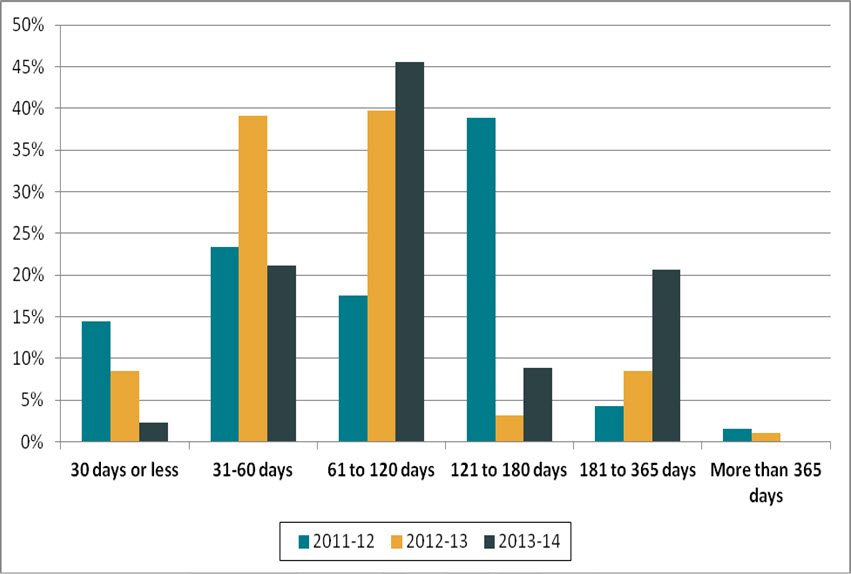
Despite completing fewer requests in 2013–2014 than in 2012–2013, AANDC took 12.7% more extensions. These extensions also tended to be for more than 30 days, as only 2.3% of extensions taken in 2013–2014 were for 30 days or less.
Figure 1. Length of extensions (2011–2012 to 2013–2014)
Text version
Figure 1 is a bar chart with vertical bars, representing the length of extensions taken by AANDC during each reporting period between 2011–2012 and 2013–2014. The results are as follows:
| Reporting period | 30 days or less | 31-60 days | 61-120 days | 121-180 days | 181-365 days | More than 365 days |
|---|---|---|---|---|---|---|
| 2011–2012 | 14.40% | 23.35% | 17.51% | 38.91% | 4.28% | 1.56% |
| 2012–2013 | 8.47% | 39.15% | 39.68% | 3.17% | 8.47% | 1.06% |
| 2013–2014 | 2.38% | 21.43% | 46.19% | 9.05% | 20.95% | 0.00% |
More than half of the extensions (141 extensions or 66.2%) taken in 2013–2014 were under section 9(1)(b) (consultation). This is similar to the proportion from the previous reporting period (53.4% in 2012–2013). Of these, 42.6% were to consult on Cabinet confidences. Based on a new table in this reporting period’s statistical report, it took more than 61 days to receive a response in all but two consultations.
Disclosure
Of the requests completed in 2013–2014, 19.8% were disclosed entirely, which represents a decrease compared to 2012–2013. This is also lower than the government-wide disclosure rate of 26.9%.
While AANDC disclosed a higher proportion of the pages it processed in 2013–2014 (38.8% compared to 31.5% in 2012–2013), this proportion is still below the government-wide average of 53.4%.
In 19.5% of requests, AANDC responded that no records existed (an increase of 3% compared to 2012–2013). In comparison, 10.5% of requests completed government-wide resulted in no records in 2013–2014.
Exemptions/Exclusions
AANDC mentioned that the government operations exemption under subsection 21(1) of the Act was used to withhold information 205 times in 2013–2014.
Section 19 (protection of personal information) and subsection 20(1) (protection of certain third party information) were also used 191 and 147 times, respectively.
In general, more exemptions were applied in 2013–2014 (775) than in 2012–2013 (631) for fewer requests.
Table 2. Performance
| Measures | Reporting Period 2012–2013 |
Reporting Period 2013–2014 |
Difference | |
|---|---|---|---|---|
| Completion of Requests | ||||
| Completion rate | 85.23% | 89.19% | 3.96% | |
| Completion Time | ||||
| % of requests completed within 30 days | 69.18% | 62.97% | 16.09% | |
| Average number of days to complete a request | 47 | 53 | 6 | |
| % of requests closed past statutory or extended deadline | 0 | 0 | N/A | |
| % of consultations from government institution completed within 30 days | 94.95% | 96.95% | 2% | |
| % of extensions of 30 days or less | 8.47% | 2.35% | -6.12% | |
| Level of Disclosure | ||||
| % of pages processed that were disclosed | 31.54% | 38.75% | 7.21% | |
| % of requests completed for which the information was disclosed entirely | 26.48% | 19.80% | -6.68% | |
| % of pages disclosed entirely | 13.87% | 10.07% | -3.80% | |
| Exemptions/Exclusions | ||||
| Number of exemptions/exclusions per request completed | 1.14 | 1.50 | 0.36 | |
Other activities
Since finding trained and qualified employees has proven to be a challenge for ATIP offices, AANDC took the lead and launched three staffing processes opened to the general public in order to create pools that could be used by all ATIP offices across the government. One of the processes was also jointly chaired by Industry Canada.
Complaints
In 2013–2014, 60 complaints were registered against AANDC.Footnote 5 As of April 2015, 26 of them were still pending, 19 were well-founded, 6 not well-founded, 8 were discontinued and 1 was settled. Most of them were refusal complaints (48 complaints; 80%).
In comparison, the OIC received 45 complaints against AANDC in 2012–2013.
Footnotes
- Footnote 1
-
While AANDC did not specify the subjects of the requests made, a review of the summaries of completed ATI requests online via the www.open.canada.ca website revealed that themes of requested information included: Indian residential schools, the new Qalipu Band in Newfoundland, funding for First Nations Child and Family Services, Nutrition North Canada program, Idle No More movement, the Giant Mine and the First Nation Education Act.
- Footnote 2
-
According to Treasury Board Secretariat’s Guide for the Statistical Report on the Access to Information Act, the category “other” could include the following: requests for the contents of a database, requests to process audio or video recordings, high profile subject matter, cases where records are in a region or other country, and cases where the records are in a language other than English or French.
- Footnote 3
-
Based on response to parliamentary written question Q-485.
- Footnote 4
-
The 2007–2008 OIC report card grading system was used to estimate the grade: A=0 to 5%, B= 5 to 10%, C=10 to 15%, D=15% to 20%, F=more than 20%.
- Footnote 5
-
The numbers reported in this section are based on the OIC’s statistics. The information may not reflect the statistics reported by institutions due to the discrepancies in the methodology used.